Western Union 2014 Annual Report Download - page 59
Download and view the complete annual report
Please find page 59 of the 2014 Western Union annual report below. You can navigate through the pages in the report by either clicking on the pages listed below, or by using the keyword search tool below to find specific information within the annual report.-
 1
1 -
2
-
3
-
4
-
5
-
6
-
7
-
8
-
9
-
10
-
11
-
12
-
13
-
14
-
15
-
16
-
17
-
18
-
19
-
20
-
21
-
22
-
23
-
24
-
25
-
26
-
27
-
28
-
29
-
30
-
31
-
32
-
33
-
34
-
35
-
36
-
37
-
38
-
39
-
40
-
41
-
42
-
43
-
44
-
45
-
46
-
47
-
48
-
 49
49 -
 50
50 -
 51
51 -
 52
52 -
 53
53 -
 54
54 -
 55
55 -
 56
56 -
 57
57 -
 58
58 -
 59
59 -
 60
60 -
 61
61 -
 62
62 -
 63
63 -
 64
64 -
 65
65 -
 66
66 -
 67
67 -
 68
68 -
 69
69 -
70
-
71
-
72
-
73
-
74
-
75
-
76
-
77
-
78
-
79
-
80
-
81
-
82
-
83
-
84
-
85
-
86
-
87
-
88
-
89
-
90
-
91
-
92
-
93
-
94
-
95
-
96
-
97
-
98
-
99
-
100
-
101
-
102
-
103
-
104
-
105
-
106
-
107
-
108
-
109
-
110
-
111
-
112
-
113
-
114
-
115
-
116
-
117
-
118
-
119
-
120
-
121
-
122
-
123
-
124
-
125
-
126
-
127
-
128
-
129
-
130
-
131
-
132
-
133
-
134
-
135
-
136
-
137
-
138
-
139
-
140
-
141
-
142
-
143
-
144
-
145
-
146
-
147
-
148
-
149
-
150
-
151
-
152
-
153
-
154
-
155
-
156
-
157
-
158
-
159
-
160
-
161
-
162
-
163
-
164
-
165
-
166
-
167
-
168
-
169
-
170
-
171
-
172
-
173
-
174
-
175
-
176
-
177
-
178
-
179
-
180
-
181
-
182
-
183
-
184
-
185
-
186
-
187
-
188
-
189
-
190
-
191
-
192
-
193
-
194
-
195
-
196
-
197
-
198
-
199
-
200
-
201
-
202
-
203
-
204
-
205
-
206
-
207
-
208
-
209
-
210
-
211
-
212
-
213
-
214
-
215
-
216
-
217
-
218
-
219
-
220
-
221
-
222
-
223
-
224
-
225
-
226
-
227
-
228
-
229
-
230
-
231
-
232
-
233
-
234
-
235
-
236
-
237
-
238
-
239
-
240
-
241
-
242
-
243
-
244
-
245
-
246
-
247
-
248
-
249
-
250
-
251
-
252
-
253
-
254
-
255
-
256
-
257
-
258
-
259
-
260
-
261
-
262
-
263
-
264
-
265
-
266
-
267
-
268
-
269
-
270
-
271
-
272
-
273
-
274
-
275
-
276
-
277
-
278
-
279
-
280
-
281
-
282
-
283
-
284
-
285
-
286
-
287
-
288
-
289
-
290
-
291
-
292
-
293
-
294
-
295
-
296
-
297
-
298
-
299
-
300
-
301
-
302
-
303
-
304
-
305
-
306
 |
 |

41 | The Western Union Company – Proxy Statement
NOTICE OF 2015 ANNUAL MEETING OF STOCKHOLDERS AND PROXY STATEMENT
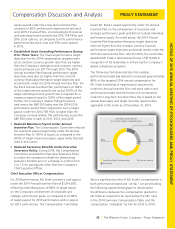
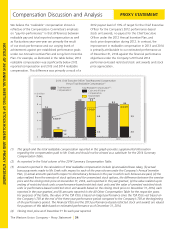
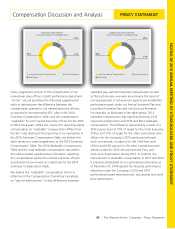
Compensation Discussion and Analysis PROXY STATEMENT
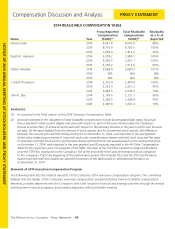
The peer group used for evaluating 2014 compensation decisions consisted of the companies below. The Compensation
Consultant compiled compensation information from the peer group based on the publicly filed documents of each
member of the peer group.
2013
Revenues
(in Millions)
2013
Operating
Income
(in Millions) Employees
Market
Capitalization
(in Millions)
(as of 12/31/13)
Ameriprise Financial $10,957 $2,178 12,235 $22,462
Automatic Data Processing $11,490 $2,069 60,000 $38,929
Charles Schwab $5,362 $1,657 13,800 $33,520
CME Group $2,947 $1,729 2,600 $26,312
Comerica $2,637 $1,114 8,967 $8,732
Discover Financial Services $9,278 $4,318 13,009 $26,789
eBay $15,510 $3,249 31,500 $71,028
Fidelity National Information Services $5,992 $1,179 35,000 $15,628
Fiserv $4,696 $1,125 20,000 $15,270
Global Payments $2,415 $406 3,954 $4,737
Intuit $4,231 $1,229 8,000 $21,744
MoneyGram $1,443 $186 2,490 $1,204
NASDAQ OMX $3,117 $752 2,506 $6,670
Northern Trust $4,219 $2,130 14,200 $14,791
State Street $10,292 $4,774 29,660 $32,387
Total Systems Services $1,978 $378 8,600 $6,332
75th Percentile $9,531 $2,142 22,415 $28,188
Median $4,464 $1,443 12,622 $18,686
25th Percentile $2,870 $1,024 6,988 $8,217
Western Union $5,542 $1,107 10,000 $9,467
All data was compiled by the Compensation Consultant who obtained peer company financial market data from Capital IQ
Compustat. The data generally represents revenue and operating income for the most recent four quarters available to the
Compensation Consultant at the time the Compensation Consultant compiled the data in January 2014. Other than for the
Company, operating income may reflect measures not in conformity with Generally Accepted Accounting Principles.
The Compensation Committee also uses general industry
compensation survey data in evaluating executive pay.
Survey data relies upon responses from participating
companies to survey questions, which are compiled and
sorted by the surveyor based on various factors, such as
the period covered, the location of the company, and the
positions under review. Survey data provides insight into
positions that may not generally be reported in proxy
statements and information about the compensation of
executives of non-public companies.
In some instances, survey data is a useful complement to
the peer group proxy data. To assist the committee in its
review of the general industry compensation survey data,
the Compensation Consultant extracts compensation
information from the surveys with respect to companies
with annual revenues generally ranging from $3billion
to$10billion. For the 2014 compensation review, the
Compensation Consultant compiled compensation
data from the following general industry compensation
surveys: 2013 U.S. Mercer Benchmark Database-Executive