WeightWatchers 2013 Annual Report Download - page 73
Download and view the complete annual report
Please find page 73 of the 2013 WeightWatchers annual report below. You can navigate through the pages in the report by either clicking on the pages listed below, or by using the keyword search tool below to find specific information within the annual report.-
 1
1 -
2
-
3
-
4
-
5
-
6
-
7
-
8
-
9
-
10
-
11
-
12
-
13
-
14
-
15
-
16
-
17
-
18
-
19
-
20
-
21
-
22
-
23
-
24
-
25
-
26
-
27
-
28
-
29
-
30
-
31
-
32
-
33
-
34
-
35
-
36
-
37
-
38
-
39
-
40
-
41
-
42
-
43
-
44
-
45
-
46
-
47
-
48
-
49
-
50
-
51
-
52
-
53
-
54
-
55
-
56
-
57
-
58
-
59
-
60
-
61
-
62
-
 63
63 -
 64
64 -
 65
65 -
 66
66 -
 67
67 -
 68
68 -
 69
69 -
 70
70 -
 71
71 -
 72
72 -
 73
73 -
 74
74 -
 75
75 -
 76
76 -
 77
77 -
 78
78 -
 79
79 -
 80
80 -
 81
81 -
 82
82 -
 83
83 -
84
-
85
-
86
-
87
-
88
-
89
-
90
-
91
-
92
-
93
-
94
-
95
-
96
-
97
-
98
-
99
-
100
-
101
-
102
-
103
-
104
-
105
-
106
-
107
-
108
-
109
-
110
-
111
-
112
-
113
-
114
-
115
-
116
-
117
-
118
-
119
-
120
-
121
-
122
-
123
-
124
-
125
-
126
-
127
-
128
-
129
-
130
-
131
-
132
-
133
-
134
-
135
-
136
-
137
-
138
 |
 |

Liquidity and Capital Resources
Cash flows provided by operating activities have historically supplied us with a significant source of
liquidity. We use these cash flows, supplemented with long-term debt and short-term borrowings, to fund our
operations and global initiatives, repurchase stock, pay down debt and opportunistically engage in franchise and
other acquisitions. On October 30, 2013, we announced that we suspended our quarterly cash dividend, as
described below (see “—Dividends”). We believe that cash flows from operating activities, together with
borrowings available under our revolving credit facility, will be sufficient for the next 12 months to fund
currently anticipated capital expenditure requirements, debt service requirements and working capital
requirements.
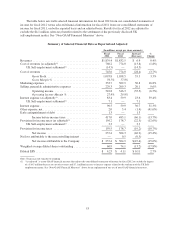
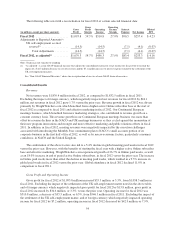
Balance Sheet Working Capital
The following table sets forth certain relevant measures of the Company’s balance sheet working capital for
the fiscal years ended:
December 28,
2013
December 29,
2012
Increase/
(Decrease)
(in millions)
Total current assets ................................ $315.7 $ 218.0 $ 97.7
Total current liabilities ............................. 345.8 447.9 (102.1)
Working capital deficit ............................. (30.1) (229.9) (199.8)
Cash and cash equivalents ........................... 174.6 70.2 104.4
Current portion of long-term debt ..................... 30.0 114.7 (84.7)
Working capital deficit, excluding change in cash and cash
equivalents and current portion of long-term debt ...... $(174.7) $(185.4) $ (10.7)
We generally operate with negative working capital. This is driven in part by our commitment plans which
are our primary payment method. These plans require members and subscribers to pay us for meetings and
subscription products, respectively, before we pay for our obligations in the normal course of business. These
prepayments are recorded as a current liability on our balance sheet which results in negative working capital.
Our working capital deficit decreased $199.8 million, to $30.1 million at December 28, 2013 from $229.9 million
at December 29, 2012. Of this decline, the debt refinancing we undertook in April 2013, as well as scheduled
debt repayments of $88.4 million which were offset by revolver borrowings of $70.0 million, lowered the current
portion of our long-term debt by $84.7 million versus the end of fiscal 2012 as described below (see “—Long-
Term Debt”).
Excluding the changes in cash and cash equivalents and current portion of long-term debt from both periods,
the working capital deficit at December 28, 2013 decreased by $10.7 million to $174.7 million from $185.4
million at December 29, 2012. The primary factors contributing to this decrease in our working capital deficit
were a timing related increase of $7.0 million in income tax liabilities, a $5.9 million reduction in inventory, a
$1.1 million decrease in accounts receivable and a $24.7 million net decrease to the working capital deficit
resulting from other operational items.
These other operational items that resulted in the net decrease of $24.7 million to the working capital deficit
included a $9.8 million decrease in deferred revenue from declines in our Online and Monthly Pass active bases,
a $6.3 million decrease in the derivative payable, a $1.3 million increase in other accrued liabilities and a $7.3
million reduction in the previously reported UK self-employment liability related to a $6.8 million payment to
HMRC in January 2013 with the balance of professional fees paid shortly thereafter.
59