WeightWatchers 2013 Annual Report Download - page 60
Download and view the complete annual report
Please find page 60 of the 2013 WeightWatchers annual report below. You can navigate through the pages in the report by either clicking on the pages listed below, or by using the keyword search tool below to find specific information within the annual report.-
 1
1 -
2
-
3
-
4
-
5
-
6
-
7
-
8
-
9
-
10
-
11
-
12
-
13
-
14
-
15
-
16
-
17
-
18
-
19
-
20
-
21
-
22
-
23
-
24
-
25
-
26
-
27
-
28
-
29
-
30
-
31
-
32
-
33
-
34
-
35
-
36
-
37
-
38
-
39
-
40
-
41
-
42
-
43
-
44
-
45
-
46
-
47
-
48
-
49
-
 50
50 -
 51
51 -
 52
52 -
 53
53 -
 54
54 -
 55
55 -
 56
56 -
 57
57 -
 58
58 -
 59
59 -
 60
60 -
 61
61 -
 62
62 -
 63
63 -
 64
64 -
 65
65 -
 66
66 -
 67
67 -
 68
68 -
 69
69 -
 70
70 -
71
-
72
-
73
-
74
-
75
-
76
-
77
-
78
-
79
-
80
-
81
-
82
-
83
-
84
-
85
-
86
-
87
-
88
-
89
-
90
-
91
-
92
-
93
-
94
-
95
-
96
-
97
-
98
-
99
-
100
-
101
-
102
-
103
-
104
-
105
-
106
-
107
-
108
-
109
-
110
-
111
-
112
-
113
-
114
-
115
-
116
-
117
-
118
-
119
-
120
-
121
-
122
-
123
-
124
-
125
-
126
-
127
-
128
-
129
-
130
-
131
-
132
-
133
-
134
-
135
-
136
-
137
-
138
 |
 |

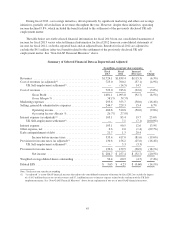
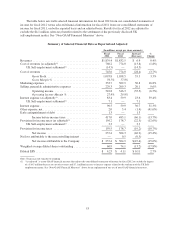
The following table sets forth a reconciliation of certain selected financial data for fiscal 2013:
(in millions, except per share amounts)
Income
Before
Taxes
Provision
for Income
Taxes
Net
Income
Diluted
EPS
Fiscal 2013 ................................................... $335.4 $130.6 $204.7 $3.63
Adjustments to Reported Amounts(1)
Early extinguishment of debt charge(1) .......................... 21.7 8.4 13.3 0.24
Total Adjustments ...................................... 21.7 8.4 13.3 0.24
Fiscal 2013, as adjusted(1) ....................................... $357.0 $139.0 $218.0 $3.87
Note: Totals may not sum due to rounding
(1) “As adjusted” is a non-GAAP financial measure that adjusts certain selected financial data for fiscal 2013.
See “Non-GAAP Financial Measures” above for an explanation of our use of non-GAAP financial measures.
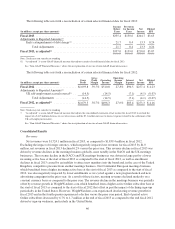
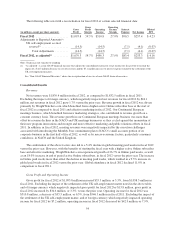
The following table sets forth a reconciliation of certain selected financial data for fiscal 2012:
(in millions, except per share amounts)
Gross
Profit
Gross
Profit
Margin
Operating
Income
Operating
Income
Margin
Interest
Expense
Net
Income
Diluted
EPS
Fiscal 2012 ........................... $1,093.8 59.5% $510.8 27.8% $90.5 $257.4 $ 4.23
Adjustments to Reported Amounts(1)
UK self-employment accrual reversal(1) . . (14.5) (14.5) (7.1) (4.1) (0.07)
Total Adjustments .............. (14.5) (14.5) (7.1) (4.1) (0.07)
Fiscal 2012, as adjusted(1) ............... $1,079.3 58.7% $496.3 27.0% $83.4 $253.3 $ 4.16
Note: Totals may not sum due to rounding
(1) “As adjusted” is a non-GAAP financial measure that adjusts the consolidated statements of net income for fiscal 2012 to exclude the
impact of a $14.5 million decrease to cost of revenues and the $7.1 million increase to interest expense related to the settlement of the
UK self-employment matter .
See “Non-GAAP Financial Measures” above for an explanation of our use of non-GAAP financial measures.
Consolidated Results
Revenues
Net revenues were $1,724.1 million in fiscal 2013, as compared to $1,839.4 million in fiscal 2012.
Excluding the impact of foreign currency, which negatively impacted our revenues for fiscal 2013 by $1.0
million, net revenues in fiscal 2013 declined 6.2% versus the prior year. This revenue decline in fiscal 2013 was
driven by revenue declines in the meetings business globally, most notably in the NACO and the UK meetings
businesses. The revenue decline in the NACO and UK meetings businesses was driven in large part by a lower
incoming active base at the start of fiscal 2013 as compared to the start of fiscal 2012, as well as enrollment
declines in fiscal 2013 caused by an inability to attract new members into the brand and, in the case of the United
Kingdom, competitive pressure from another meetings business. Our Continental European meetings business,
which benefitted from a higher incoming active base at the start of fiscal 2013 as compared to the start of fiscal
2012, was also negatively impacted by lower enrollments as we cycled against a new program launch and new
advertising campaigns in the prior year. As a result of these factors, meeting revenues declined modestly on a
constant currency basis as compared to the prior year. The revenue decline in the meetings business was partially
offset by revenue growth in WeightWatchers.com which benefited from a higher active Online subscriber base at
the start of fiscal 2013 as compared to the start of fiscal 2012 that offset in part the impact of declining sign-ups
particularly in the United States. However, WeightWatchers.com experienced decelerating revenue growth for
fiscal 2013 and in the fourth quarter experienced a decline versus the prior year period. End of period active
Online subscribers decreased by 6.7% to 1.7 million at the end of fiscal 2013 as compared to the end fiscal 2012
driven by sign-up weakness, particularly in the United States.
46