WeightWatchers 2013 Annual Report Download - page 63
Download and view the complete annual report
Please find page 63 of the 2013 WeightWatchers annual report below. You can navigate through the pages in the report by either clicking on the pages listed below, or by using the keyword search tool below to find specific information within the annual report.-
 1
1 -
2
-
3
-
4
-
5
-
6
-
7
-
8
-
9
-
10
-
11
-
12
-
13
-
14
-
15
-
16
-
17
-
18
-
19
-
20
-
21
-
22
-
23
-
24
-
25
-
26
-
27
-
28
-
29
-
30
-
31
-
32
-
33
-
34
-
35
-
36
-
37
-
38
-
39
-
40
-
41
-
42
-
43
-
44
-
45
-
46
-
47
-
48
-
49
-
50
-
51
-
52
-
 53
53 -
 54
54 -
 55
55 -
 56
56 -
 57
57 -
 58
58 -
 59
59 -
 60
60 -
 61
61 -
 62
62 -
 63
63 -
 64
64 -
 65
65 -
 66
66 -
 67
67 -
 68
68 -
 69
69 -
 70
70 -
 71
71 -
 72
72 -
 73
73 -
74
-
75
-
76
-
77
-
78
-
79
-
80
-
81
-
82
-
83
-
84
-
85
-
86
-
87
-
88
-
89
-
90
-
91
-
92
-
93
-
94
-
95
-
96
-
97
-
98
-
99
-
100
-
101
-
102
-
103
-
104
-
105
-
106
-
107
-
108
-
109
-
110
-
111
-
112
-
113
-
114
-
115
-
116
-
117
-
118
-
119
-
120
-
121
-
122
-
123
-
124
-
125
-
126
-
127
-
128
-
129
-
130
-
131
-
132
-
133
-
134
-
135
-
136
-
137
-
138
 |
 |
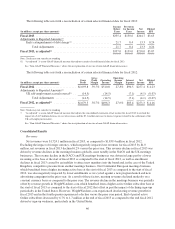
European meeting fees in fiscal 2013 by $3.9 million, Continental European meeting fees decreased by 1.8% in
fiscal 2013 as compared to the prior year. The decrease in meeting fees on a constant currency basis was driven
by a decrease of 1.5% in Continental European meeting paid weeks in fiscal 2013 versus the prior year. The
decrease in meeting paid weeks was driven by lower enrollments in fiscal 2013 as compared to the prior year.
These lower enrollments were the result of cycling against the successful launch of the new program and the new
advertising campaigns in the prior year. However, the impact of enrollments on meeting paid weeks was
minimized by the higher meetings active base at the beginning of fiscal 2013 versus the beginning of fiscal 2012.
In Continental Europe, attendance decreased by 8.1% in fiscal 2013 versus the prior year.
In-Meeting Product Sales
Global in-meeting product sales for fiscal 2013 were $212.0 million, a decrease of $41.3 million, or 16.3%,
from $253.2 million in fiscal 2012. This decrease resulted primarily from a 15.5% decline in global meeting
attendance in fiscal 2013 versus the prior year. Additionally, product sales per attendee decreased 1.0% in fiscal
2013 versus the prior year. This decrease in global in-meeting product sales per attendee in fiscal 2013 was
driven by declines in NACO, which were only partially offset by strong per attendee sales of consumables across
Continental Europe.
In NACO, fiscal 2013 in-meeting product sales of $119.1 million decreased by $26.8 million, or 18.4%,
versus the prior year. This decrease resulted primarily from a 14.7% attendance decline in fiscal 2013 as
compared to the prior year. In-meeting product sales per attendee decreased by 4.3% in fiscal 2013 versus the
prior year as sales declines in consumables, enrollment products and electronics more than offset strong sales of
the new ActiveLink product, which was first introduced in the third quarter of fiscal 2012. Enrollment weakness
in NACO in fiscal 2013 contributed to these sales declines.
International in-meeting product sales were $92.9 million in fiscal 2013, a decrease of 13.5%, or 13.7% on a
constant currency basis, versus the prior year. This decrease was driven primarily by an attendance decline of
16.8% in fiscal 2013 as compared to fiscal 2012, which was largely driven by the United Kingdom. In-meeting
product sales per attendee in fiscal 2013 increased by 4.0%, or 3.7% on a constant currency basis, as compared to
the prior year. This increase was the result of strong sales of consumables in Continental Europe driven in part by
new product introductions and successful promotions.
Internet Revenues
Internet revenues, which include subscription revenues from sales of our Weight Watchers Online and
Weight Watchers eTools products as well as Internet advertising revenues, increased $17.9 million, or 3.5%, to
$522.2 million in fiscal 2013 from $504.3 million in fiscal 2012. Excluding the impact of foreign currency,
which increased Internet revenues for fiscal 2013 by $0.3 million, Internet revenues grew by 3.5% in fiscal 2013
versus the prior year. This increase was driven primarily by the benefit of an increase in pricing for Online in
many of our markets and, to a lesser extent, the higher active Online subscriber base at the beginning of fiscal
2013, up 18.0%, versus the beginning of fiscal 2012, and Online paid weeks growth of 1.7% in fiscal 2013 versus
the prior year. This growth in Online paid weeks was driven by effective marketing campaigns in Continental
Europe in fiscal 2013. However, the trend of Online paid weeks growth slowed in fiscal 2013. This deceleration
was driven largely by declining sign-ups, particularly in the United States, as the commercial weight loss
category continued to be impacted by increasing consumer trial of activity monitors and free apps. End of period
active Online subscribers decreased by 6.7% to 1.7 million at the end of fiscal 2013 as compared to the end of
fiscal 2012.
Other Revenues
Other revenues, comprised primarily of licensing revenues, franchise royalties, revenues from the sale of
products by mail and to our franchisees, and revenues from our publications, were $138.3 million for fiscal 2013,
49