WeightWatchers 2013 Annual Report Download - page 64
Download and view the complete annual report
Please find page 64 of the 2013 WeightWatchers annual report below. You can navigate through the pages in the report by either clicking on the pages listed below, or by using the keyword search tool below to find specific information within the annual report.-
 1
1 -
2
-
3
-
4
-
5
-
6
-
7
-
8
-
9
-
10
-
11
-
12
-
13
-
14
-
15
-
16
-
17
-
18
-
19
-
20
-
21
-
22
-
23
-
24
-
25
-
26
-
27
-
28
-
29
-
30
-
31
-
32
-
33
-
34
-
35
-
36
-
37
-
38
-
39
-
40
-
41
-
42
-
43
-
44
-
45
-
46
-
47
-
48
-
49
-
50
-
51
-
52
-
53
-
 54
54 -
 55
55 -
 56
56 -
 57
57 -
 58
58 -
 59
59 -
 60
60 -
 61
61 -
 62
62 -
 63
63 -
 64
64 -
 65
65 -
 66
66 -
 67
67 -
 68
68 -
 69
69 -
 70
70 -
 71
71 -
 72
72 -
 73
73 -
 74
74 -
75
-
76
-
77
-
78
-
79
-
80
-
81
-
82
-
83
-
84
-
85
-
86
-
87
-
88
-
89
-
90
-
91
-
92
-
93
-
94
-
95
-
96
-
97
-
98
-
99
-
100
-
101
-
102
-
103
-
104
-
105
-
106
-
107
-
108
-
109
-
110
-
111
-
112
-
113
-
114
-
115
-
116
-
117
-
118
-
119
-
120
-
121
-
122
-
123
-
124
-
125
-
126
-
127
-
128
-
129
-
130
-
131
-
132
-
133
-
134
-
135
-
136
-
137
-
138
 |
 |
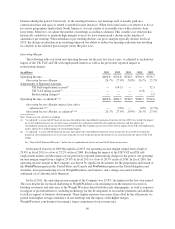
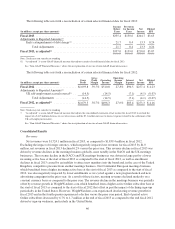
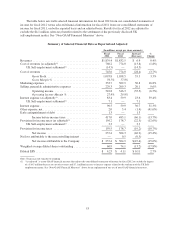
a decrease of $8.6 million, or 5.9%, from $146.9 million for fiscal 2012. Excluding the impact of foreign
currency, which decreased other revenues for fiscal 2013 by $0.5 million, other revenues were 5.5% lower in
fiscal 2013 compared to the prior year. Franchise commissions and sales of products to our franchisees declined
in the aggregate by 35.1%, or 34.8% on a constant currency basis, in fiscal 2013 versus the prior year. This
decline in franchise commissions and sales of products to our franchisees was driven in part by our recent
franchise acquisitions. Our by mail product sales and revenues from our publications also declined in the
aggregate by 3.2%, or 2.6% on a constant currency basis, in fiscal 2013 versus the prior year. Global licensing
revenues increased by 2.1%, or 2.4% on a constant currency basis, in fiscal 2013 versus the prior year. Included
in global licensing revenues in fiscal 2012 was a $2.0 million one-time termination fee which benefited that
period. Excluding this one-time termination fee, global licensing revenues in fiscal 2013 increased 4.9%, or 5.2%
on a constant currency basis versus the prior year.
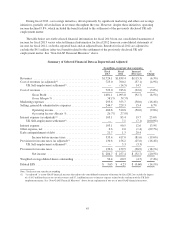
Components of Expenses and Margins
Cost of Revenues and Gross Margin
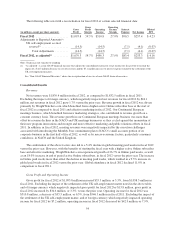
Total cost of revenues in fiscal 2013 was $723.0 million, a decline of $22.6 million from $745.6 million in
the prior year. Excluding the impact of the settlement of the UK self-employment matter, total cost of revenues in
fiscal 2013 would have declined $37.1 million, or 4.9%, from $760.2 million in the prior year. As adjusted for
this 2012 settlement, gross profit in fiscal 2013 of $1,001.1 million decreased $78.2 million, or 7.2%, from
$1,079.3 million in 2012. Gross margin in fiscal 2013 was 58.1%, as compared to adjusted gross margin of
58.7% in fiscal 2012. Gross margin compression was driven by operating cost deleverage in both the meetings
and Weight Watchers.com businesses. This margin compression was partially offset by the shift of revenue
towards the higher margin WeightWatchers.com business. The decline in the meetings business gross margin
was driven by the lower average number of members per meeting, the impact of the US service provider
compensation changes, an increase in product discounting globally as well as higher product and freight costs in
NACO. Price increases taken in some of our markets and reduced cost of meeting materials in NACO were
partially offsetting. The WeightWatchers.com business gross margin also declined in fiscal 2013 driven partially
by the change in cost allocations for call center and technology expenses as well as operating cost deleverage.
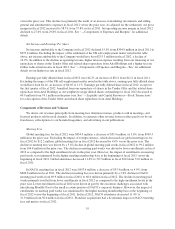
Marketing
Marketing expenses for fiscal 2013 were $295.6 million, a decrease of $58.0 million, or 16.4%, versus fiscal
2012. Excluding the impact of foreign currency, which increased marketing expenses for fiscal 2013 by $0.5
million, marketing expenses were 16.5% lower in fiscal 2013 compared to the prior year. The decline was
primarily driven by the absence of a Weight Watchers Online US men’s specific marketing campaign, achieving
lower and more efficient digital marketing spend in the United States in fiscal 2013 and lower TV advertising
and production costs globally. Marketing expenses as a percentage of revenue were 17.1% in fiscal 2013 as
compared to 19.2% in the prior year.
Selling, General and Administrative
Selling, general and administrative expenses were $244.7 million for fiscal 2013 versus $229.3 million for
fiscal 2012, an increase of $15.4 million, or 6.7%. Excluding the impact of foreign currency, which decreased
selling, general and administrative expenses for fiscal 2013 by $0.2 million, fiscal 2013 selling, general and
administrative expenses increased by 6.8% versus fiscal 2012. The increase in expenses was primarily related to
higher bonus expenses, investments in technology for the development of our mobile, field systems and customer
relationship management platforms in support of our healthcare initiatives, one-time costs associated with the
impairment of intangible and long-lived assets, severance, China shutdown costs and costs related to our
acquisitions partially offset by lower stock compensation expense in fiscal 2013. Selling, general and
administrative expenses as a percentage of revenue for fiscal 2013 increased to 14.2% from 12.5% for fiscal
2012.
50