WeightWatchers 2013 Annual Report Download - page 115
Download and view the complete annual report
Please find page 115 of the 2013 WeightWatchers annual report below. You can navigate through the pages in the report by either clicking on the pages listed below, or by using the keyword search tool below to find specific information within the annual report.-
 1
1 -
2
-
3
-
4
-
5
-
6
-
7
-
8
-
9
-
10
-
11
-
12
-
13
-
14
-
15
-
16
-
17
-
18
-
19
-
20
-
21
-
22
-
23
-
24
-
25
-
26
-
27
-
28
-
29
-
30
-
31
-
32
-
33
-
34
-
35
-
36
-
37
-
38
-
39
-
40
-
41
-
42
-
43
-
44
-
45
-
46
-
47
-
48
-
49
-
50
-
51
-
52
-
53
-
54
-
55
-
56
-
57
-
58
-
59
-
60
-
61
-
62
-
63
-
64
-
65
-
66
-
67
-
68
-
69
-
70
-
71
-
72
-
73
-
74
-
75
-
76
-
77
-
78
-
79
-
80
-
81
-
82
-
83
-
84
-
85
-
86
-
87
-
88
-
89
-
90
-
91
-
92
-
93
-
94
-
95
-
96
-
97
-
98
-
99
-
100
-
101
-
102
-
103
-
104
-
 105
105 -
 106
106 -
 107
107 -
 108
108 -
 109
109 -
 110
110 -
 111
111 -
 112
112 -
 113
113 -
 114
114 -
 115
115 -
 116
116 -
 117
117 -
 118
118 -
 119
119 -
 120
120 -
 121
121 -
 122
122 -
 123
123 -
 124
124 -
 125
125 -
126
-
127
-
128
-
129
-
130
-
131
-
132
-
133
-
134
-
135
-
136
-
137
-
138
 |
 |

WEIGHT WATCHERS INTERNATIONAL, INC. AND SUBSIDIARIES
NOTES TO CONSOLIDATED FINANCIAL STATEMENTS
(IN THOUSANDS, EXCEPT PER SHARE AMOUNTS)
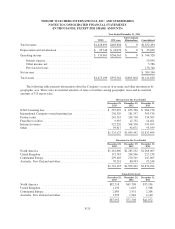
Year Ended December 31, 2011
WWI WW.com
Intercompany
Eliminations Consolidated
Total revenue .................................... $1,428,690 $403,804 $ 0 $1,832,494
Depreciation and amortization ....................... $ 25,744 $ 10,076 $ 0 $ 35,820
Operating income ................................. $ 339,963 $206,365 $ 0 $ 546,328
Interest expense ............................... 59,850
Other income, net ............................. 3,386
Provision for taxes ............................ 178,748
Net income ...................................... $ 304,344
Total assets ...................................... $1,413,109 $392,381 $(683,862) $1,121,628
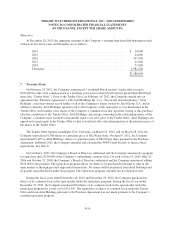
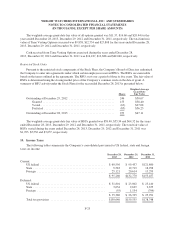
The following table presents information about the Company’s sources of revenue and other information by
geographic area. There were no material amounts of sales or transfers among geographic areas and no material
amounts of US export sales.
Revenues for the Year Ended
December 28,
2013
December 29,
2012
December 31,
2011
NACO meeting fees ........................................ $ 595,097 $ 653,396 $ 686,758
International Company-owned meeting fees ..................... 256,529 281,537 303,538
Product sales .............................................. 245,319 294,758 334,303
Franchise royalties .......................................... 9,035 12,732 14,461
Internet revenues ........................................... 522,226 504,338 399,495
Other .................................................... 95,917 92,671 93,939
$1,724,123 $1,839,432 $1,832,494
Revenues for the Year Ended
December 28,
2013
December 29,
2012
December 31,
2011
North America ............................................. $1,181,696 $1,283,232 $1,266,005
United Kingdom ........................................... 172,783 204,506 227,238
Continental Europe ......................................... 299,403 270,701 247,003
Australia, New Zealand and other .............................. 70,241 80,993 92,248
$1,724,123 $1,839,432 $1,832,494
Long-Lived Assets
December 28,
2013
December 29,
2012
December 31,
2011
North America ............................................. $82,518 $65,708 $35,196
United Kingdom ........................................... 1,192 1,645 1,508
Continental Europe ......................................... 2,083 2,431 2,208
Australia, New Zealand and other .............................. 1,259 1,984 2,160
$87,052 $71,768 $41,072
F-29