WeightWatchers 2013 Annual Report Download - page 58
Download and view the complete annual report
Please find page 58 of the 2013 WeightWatchers annual report below. You can navigate through the pages in the report by either clicking on the pages listed below, or by using the keyword search tool below to find specific information within the annual report.-
 1
1 -
2
-
3
-
4
-
5
-
6
-
7
-
8
-
9
-
10
-
11
-
12
-
13
-
14
-
15
-
16
-
17
-
18
-
19
-
20
-
21
-
22
-
23
-
24
-
25
-
26
-
27
-
28
-
29
-
30
-
31
-
32
-
33
-
34
-
35
-
36
-
37
-
38
-
39
-
40
-
41
-
42
-
43
-
44
-
45
-
46
-
47
-
 48
48 -
 49
49 -
 50
50 -
 51
51 -
 52
52 -
 53
53 -
 54
54 -
 55
55 -
 56
56 -
 57
57 -
 58
58 -
 59
59 -
 60
60 -
 61
61 -
 62
62 -
 63
63 -
 64
64 -
 65
65 -
 66
66 -
 67
67 -
 68
68 -
69
-
70
-
71
-
72
-
73
-
74
-
75
-
76
-
77
-
78
-
79
-
80
-
81
-
82
-
83
-
84
-
85
-
86
-
87
-
88
-
89
-
90
-
91
-
92
-
93
-
94
-
95
-
96
-
97
-
98
-
99
-
100
-
101
-
102
-
103
-
104
-
105
-
106
-
107
-
108
-
109
-
110
-
111
-
112
-
113
-
114
-
115
-
116
-
117
-
118
-
119
-
120
-
121
-
122
-
123
-
124
-
125
-
126
-
127
-
128
-
129
-
130
-
131
-
132
-
133
-
134
-
135
-
136
-
137
-
138
 |
 |
term U.S. Treasury securities. The market risk premium is generally determined by reviewing external market
data. When appropriate, we further adjust the resulting combined rate to account for certain entity-specific
factors such as maturity of the market in order to determine the utilized discount rate. The cost of debt is our
average borrowing rate for the period. The discount rates used in our fiscal 2013 year-end impairment test and
our fiscal 2012 year-end impairment test averaged approximately 9.1% and 9.2%, respectively.
At the end of fiscal 2013, we estimated that approximately 99% of our goodwill and 87% of our franchise
rights acquired had a fair value at least 50% higher than their respective carrying amounts. In the United States,
the region which held approximately 41% of the goodwill and 83% of the franchise rights acquired, the aggregate
fair value of both our reporting units and franchise rights acquired was at least 50% higher than the aggregate
carrying value of the reporting units and franchise rights acquired, respectively. Given that there is a significant
difference between the fair value and carrying value of our franchise rights acquired, we believe there are
currently no reasonably likely changes in assumptions that would cause a material impairment charge.
Information concerning significant accounting policies affecting us is set forth in Note 2 of our consolidated
financial statements, contained in Part IV, Item 15 of this Annual Report on Form 10-K.
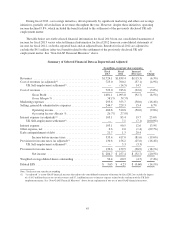
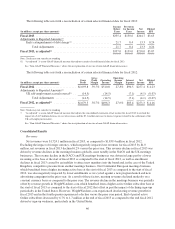
RESULTS OF OPERATIONS FOR FISCAL 2013 (52 weeks) COMPARED TO FISCAL 2012 (52 weeks)
OVERVIEW
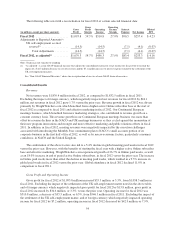
Fiscal 2012 was a year of modest revenue growth of 0.4%, with growth in the Online business almost fully
offset by declines in the meetings business. In fiscal 2012, total paid weeks continued to grow at a decelerating
rate in each fiscal quarter versus the prior year period due to a challenging recruitment environment, particularly
from our global meetings business.
This challenging recruitment environment continued for both the Online and meetings businesses into fiscal
2013, with increased competitive pressure in the Online business from the increasing consumer trial of activity
monitors and free apps. As we entered fiscal 2013, our meetings business active base was lower than the
beginning of fiscal 2012. Conversely, though our active Online subscriber base had a declining growth trend
throughout fiscal 2012, this subscriber base was higher at the beginning of fiscal 2013 than at the beginning of
fiscal 2012. The difficult recruitment environment in fiscal 2013 had the impact of further reducing the active
bases in both our meetings and Online businesses as we progressed through fiscal 2013.
Each fiscal 2013 quarter had consistently weak and deteriorating recruitment performance, which further
drove declining active bases, as compared to the prior year period resulting in paid weeks and revenue trends that
became progressively worse throughout the year with the fourth quarter of fiscal 2013 having the weakest
performance. In the first quarter of fiscal 2013, total paid weeks were still above the prior year period by
1.4%. However, in the second, third and fourth quarters of fiscal 2013, driven by this negative recruitment trend,
total paid weeks declined 2.5%, 6.6% and 8.5%, respectively, as compared to the prior year period. Online paid
weeks in the third quarter of fiscal 2013 declined 2.6% versus the prior year period. This was the first time in our
history that Online paid weeks declined on a year-over-year basis.
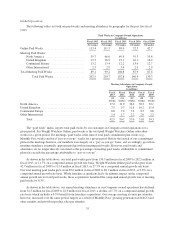
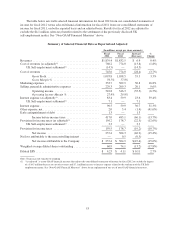
Driven by the decline in paid weeks, total revenue for fiscal 2013 declined 6.3% as compared to the prior
year. This revenue decrease was driven primarily by the meetings business where revenue declined in all four
quarters versus the respective prior year periods, with a full year decline of 10.1% versus the prior year.
Conversely, Online revenues grew in the first three quarters, but at decelerating rates, such that by the fourth
quarter of fiscal 2013, our Online business had its first-ever quarter of declining revenue versus the prior year
period, down 5.2%. However, for the full year of fiscal 2013, Online revenues increased 3.5% versus the prior
year.
44