WeightWatchers 2013 Annual Report Download - page 55
Download and view the complete annual report
Please find page 55 of the 2013 WeightWatchers annual report below. You can navigate through the pages in the report by either clicking on the pages listed below, or by using the keyword search tool below to find specific information within the annual report.-
 1
1 -
2
-
3
-
4
-
5
-
6
-
7
-
8
-
9
-
10
-
11
-
12
-
13
-
14
-
15
-
16
-
17
-
18
-
19
-
20
-
21
-
22
-
23
-
24
-
25
-
26
-
27
-
28
-
29
-
30
-
31
-
32
-
33
-
34
-
35
-
36
-
37
-
38
-
39
-
40
-
41
-
42
-
43
-
44
-
 45
45 -
 46
46 -
 47
47 -
 48
48 -
 49
49 -
 50
50 -
 51
51 -
 52
52 -
 53
53 -
 54
54 -
 55
55 -
 56
56 -
 57
57 -
 58
58 -
 59
59 -
 60
60 -
 61
61 -
 62
62 -
 63
63 -
 64
64 -
 65
65 -
66
-
67
-
68
-
69
-
70
-
71
-
72
-
73
-
74
-
75
-
76
-
77
-
78
-
79
-
80
-
81
-
82
-
83
-
84
-
85
-
86
-
87
-
88
-
89
-
90
-
91
-
92
-
93
-
94
-
95
-
96
-
97
-
98
-
99
-
100
-
101
-
102
-
103
-
104
-
105
-
106
-
107
-
108
-
109
-
110
-
111
-
112
-
113
-
114
-
115
-
116
-
117
-
118
-
119
-
120
-
121
-
122
-
123
-
124
-
125
-
126
-
127
-
128
-
129
-
130
-
131
-
132
-
133
-
134
-
135
-
136
-
137
-
138
 |
 |
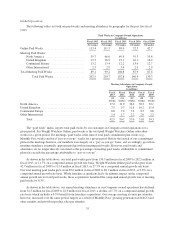
In fiscal 2012, excluding the impact of the UK self-employment matter, operating income margin declined
to 27.0% from 29.8% in the prior year. This decline in operating income margin was primarily driven by costs
related to first time Online TV marketing campaigns in several of our international markets and our significant
investment in marketing the Weight Watchers Online product to men in the United States, as well as, selling,
general and administrative expenses in support of our growth initiatives.
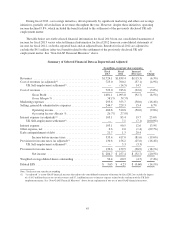
In fiscal 2013, operating income margin further declined to 26.7% from an adjusted operating income
margin of 27.0% in the prior year. This decrease in operating income margin was primarily the result of lower
gross margin largely offset by lower marketing expense. Lower marketing expense was driven primarily from the
elimination of inefficient digital advertising and the lack of a men’s campaign in the United States, in fiscal 2013
versus the prior year.
Non-GAAP Financial Measures
To supplement our consolidated results presented in accordance with accounting principles generally
accepted in the United States, or GAAP, we have disclosed non-GAAP financial measures of operating results
that exclude or adjust certain items. Net income and earnings per fully diluted share are discussed in this Annual
Report on Form 10-K both as reported (on a GAAP basis) and as adjusted (on a non-GAAP basis) to exclude the
impact from the early extinguishment of debt charge recorded in connection with our previously announced
April 2, 2013 refinancing of our long-term debt. Net revenues, cost of revenues, gross profit and gross margin,
operating income and operating income margin, net income, earnings per fully diluted share, and effective tax
rate, including components thereof, are discussed in this Annual Report on Form 10-K both as reported (on a
GAAP basis) and as adjusted (on a non-GAAP basis) to exclude from fiscal 2012, in connection with the
settlement of the UK self-employment matter, the benefit of a partial accrual reversal of a charge originally
recorded in the fourth quarter of fiscal 2009, and from fiscal 2010 the revenue benefit of a partial accrual reversal
of a charge originally recorded in connection with the previously disclosed adverse UK VAT ruling; and to adjust
fiscal 2009 results for both the impact of the UK self-employment matter and the impact of restructuring charges
associated with our previously disclosed cost savings initiatives. We generally refer to such non-GAAP measures
as excluding or adjusting for the impact of the early extinguishment of debt charge, the settlement, accrual
reversal, these rulings, these matters and/or these restructuring charges. Our management believes these non-
GAAP financial measures provide supplemental information to investors regarding the performance of our
business and are useful for period-over-period comparisons of the performance of our business. While we believe
that these financial measures are useful in evaluating our business, this information should be considered as
supplemental in nature and is not meant to be considered in isolation or as a substitute for the related financial
information prepared in accordance with GAAP. In addition, these non-GAAP financial measures may not be the
same as similarly entitled measures reported by other companies.
Use of Constant Currency
As exchange rates are an important factor in understanding period-to-period comparisons, we believe the
presentation of results on a constant currency basis in addition to reported results helps improve investors’ ability
to understand our operating results and evaluate our performance in comparison to prior periods. Constant
currency information compares results between periods as if exchange rates had remained constant period-over-
period. We use results on a constant currency basis as one measure to evaluate our performance. In this Annual
Report on Form 10-K, we calculate constant currency by calculating current-year results using prior-year foreign
currency exchange rates. We generally refer to such amounts calculated on a constant currency basis as excluding
or adjusting for the impact of foreign currency or being on a constant currency basis. These results should be
considered in addition to, not as a substitute for, results reported in accordance with GAAP. Results on a constant
currency basis, as we present them, may not be comparable to similarly titled measures used by other companies
and are not measures of performance presented in accordance with GAAP.
41