WeightWatchers 2013 Annual Report Download - page 49
Download and view the complete annual report
Please find page 49 of the 2013 WeightWatchers annual report below. You can navigate through the pages in the report by either clicking on the pages listed below, or by using the keyword search tool below to find specific information within the annual report.-
 1
1 -
2
-
3
-
4
-
5
-
6
-
7
-
8
-
9
-
10
-
11
-
12
-
13
-
14
-
15
-
16
-
17
-
18
-
19
-
20
-
21
-
22
-
23
-
24
-
25
-
26
-
27
-
28
-
29
-
30
-
31
-
32
-
33
-
34
-
35
-
36
-
37
-
38
-
 39
39 -
 40
40 -
 41
41 -
 42
42 -
 43
43 -
 44
44 -
 45
45 -
 46
46 -
 47
47 -
 48
48 -
 49
49 -
 50
50 -
 51
51 -
 52
52 -
 53
53 -
 54
54 -
 55
55 -
 56
56 -
 57
57 -
 58
58 -
 59
59 -
60
-
61
-
62
-
63
-
64
-
65
-
66
-
67
-
68
-
69
-
70
-
71
-
72
-
73
-
74
-
75
-
76
-
77
-
78
-
79
-
80
-
81
-
82
-
83
-
84
-
85
-
86
-
87
-
88
-
89
-
90
-
91
-
92
-
93
-
94
-
95
-
96
-
97
-
98
-
99
-
100
-
101
-
102
-
103
-
104
-
105
-
106
-
107
-
108
-
109
-
110
-
111
-
112
-
113
-
114
-
115
-
116
-
117
-
118
-
119
-
120
-
121
-
122
-
123
-
124
-
125
-
126
-
127
-
128
-
129
-
130
-
131
-
132
-
133
-
134
-
135
-
136
-
137
-
138
 |
 |

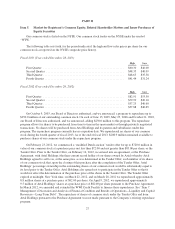
Global Operations
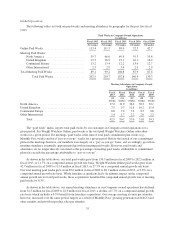
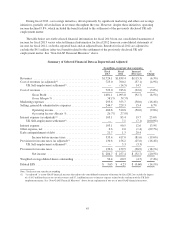
The following tables set forth our paid weeks and meeting attendance by geography for the past five fiscal
years:
Paid Weeks in Company-Owned Operations
(in millions)
Fiscal 2013 Fiscal 2012 Fiscal 2011 Fiscal 2010 Fiscal 2009
(52 weeks) (52 weeks) (52 weeks) (52 weeks) (52 weeks)
Online Paid Weeks ........................... 113.4 111.5 88.0 52.5 42.7
Meeting Paid Weeks:
North America ........................... 59.7 66.0 69.9 55.3 55.8
United Kingdom ......................... 13.7 16.9 19.1 16.1 16.2
Continental Europe ....................... 13.2 13.4 12.2 13.6 12.7
Other International ....................... 2.5 2.9 3.6 2.9 2.9
Total Meeting Paid Weeks ..................... 89.1 99.2 104.8 87.9 87.6
Total Paid Weeks ..................... 202.5 210.7 192.8 140.4 130.3
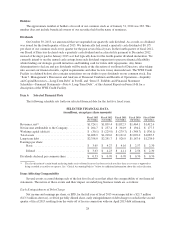
Meeting Attendance in Company-Owned
Operations
(in millions)
Fiscal
2013
Fiscal
2012
Fiscal
2011
Fiscal
2010
Fiscal
2009
(52
weeks)
(52
weeks)
(52
weeks)
(52
weeks)
(52
weeks)
North America .............................................. 27.2 31.9 36.0 30.3 32.1
United Kingdom ............................................ 7.5 9.7 11.6 10.2 11.4
Continental Europe .......................................... 6.8 7.4 7.2 8.5 8.6
Other International .......................................... 1.4 1.7 2.2 2.0 2.2
Total ................................................. 42.9 50.7 57.0 51.0 54.3
The “paid week” metric reports total paid weeks by our customers in Company-owned operations for a
given period. For Weight Watchers Online, paid weeks is the total paid Weight Watchers Online subscriber
weeks for a given period. For meetings, paid weeks is the sum of total paid commitment plan weeks (e.g.,
Monthly Pass weeks) and total “pay-as-you-go” weeks for a given period. Before the launch of our commitment
plans in the meetings business, our members were largely on a “pay-as-you-go” basis, and accordingly, growth in
meeting attendance essentially approximated growth in meeting paid weeks. However, paid weeks and
attendance are no longer directly correlated as the percentage of meeting paid weeks attributable to commitment
plans far exceeds the percentage attributable to “pay-as-you-go”.
As shown in the table above, our total paid weeks grew from 130.3 million in fiscal 2009 to 202.5 million in
fiscal 2013, or 11.7% on a compound annual growth rate basis. Weight Watchers Online paid weeks grew from
42.7 million in fiscal 2009 to 113.4 million in fiscal 2013, or 27.7% on a compound annual growth rate basis.
Our total meeting paid weeks grew from 87.6 million in fiscal 2009 to 89.1 million in fiscal 2013, or 0.4% on a
compound annual growth rate basis. While franchise acquisitions had a de minimis impact on the compound
annual growth rate for total paid weeks, these acquisitions benefited the compound annual growth rate of meeting
paid weeks by 0.3%.
As shown in the table above, our annual meeting attendance in our Company-owned operations has declined
from 54.3 million for fiscal 2009 to 42.9 million for fiscal 2013, a decline of 5.7% on a compound annual growth
rate basis which includes a 0.5% benefit from franchise acquisitions. Our average meeting revenue per attendee,
however, increased over the same period, largely as a result of Monthly Pass’ growing penetration in NACO and
other markets and growth in product sales per attendee.
35