WeightWatchers 2013 Annual Report Download - page 54
Download and view the complete annual report
Please find page 54 of the 2013 WeightWatchers annual report below. You can navigate through the pages in the report by either clicking on the pages listed below, or by using the keyword search tool below to find specific information within the annual report.-
 1
1 -
2
-
3
-
4
-
5
-
6
-
7
-
8
-
9
-
10
-
11
-
12
-
13
-
14
-
15
-
16
-
17
-
18
-
19
-
20
-
21
-
22
-
23
-
24
-
25
-
26
-
27
-
28
-
29
-
30
-
31
-
32
-
33
-
34
-
35
-
36
-
37
-
38
-
39
-
40
-
41
-
42
-
43
-
 44
44 -
 45
45 -
 46
46 -
 47
47 -
 48
48 -
 49
49 -
 50
50 -
 51
51 -
 52
52 -
 53
53 -
 54
54 -
 55
55 -
 56
56 -
 57
57 -
 58
58 -
 59
59 -
 60
60 -
 61
61 -
 62
62 -
 63
63 -
 64
64 -
65
-
66
-
67
-
68
-
69
-
70
-
71
-
72
-
73
-
74
-
75
-
76
-
77
-
78
-
79
-
80
-
81
-
82
-
83
-
84
-
85
-
86
-
87
-
88
-
89
-
90
-
91
-
92
-
93
-
94
-
95
-
96
-
97
-
98
-
99
-
100
-
101
-
102
-
103
-
104
-
105
-
106
-
107
-
108
-
109
-
110
-
111
-
112
-
113
-
114
-
115
-
116
-
117
-
118
-
119
-
120
-
121
-
122
-
123
-
124
-
125
-
126
-
127
-
128
-
129
-
130
-
131
-
132
-
133
-
134
-
135
-
136
-
137
-
138
 |
 |

business during the period. Conversely, in the meetings business, our meetings staff is usually paid on a
commission basis and space is rented as needed in most instances. When it becomes more cost effective to do so,
in various geographies (particularly North America), we rent centers at reasonable rates with relatively short
lease terms. Moreover, we adjust the number of meetings according to demand. This variable cost structure has
historically enabled us to maintain high margins even as we have experienced a decline in the number of
attendances per meeting. When attendances per meeting decline, our gross margins typically decline. In fiscal
2013, the decline in attendances per meeting outpaced our ability to reduce the meetings infrastructure resulting
in a decline in the adjusted gross margin versus the prior year.
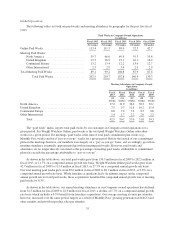
Operating Margin
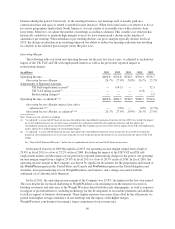
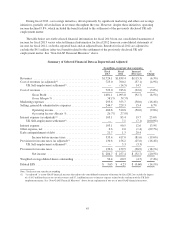
The following table sets forth our Operating Income for the past five fiscal years, as adjusted to exclude the
impact of the UK VAT and UK self-employment matters as well as the previously reported impact of
restructuring charges:
(in millions) 2013 2012 2011 2010 2009
Operating Income ....................................... $460.8 $510.8 $546.3 $390.3 $356.7
Operating Income Margin ............................ 26.7% 27.8% 29.8% 26.7% 25.2%
Adjustments to Reported Amounts
UK Self-employment accrual(1) .................... — (14.5) — — 32.5
UK VAT ruling accrual(2) ......................... — — — (2.0) —
Restructuring charges(1) .......................... ———— 5.5
Operating Income, as adjusted(1) (2) ......................... $460.8 $496.3 $546.3 $388.3 $394.6
Operating Income Margin impact from above
adjustments(1)(2) ................................... — 0.8% — 0.0% (2.7%)
Operating Income Margin, as adjusted(1) (2) ............... 26.7% 27.0% 29.8% 26.5% 27.9%
Note: Totals may not sum due to rounding
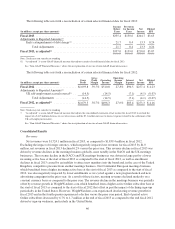
(1) “As adjusted” is a non-GAAP financial measure that adjusts the consolidated statements of income for fiscal 2012 to exclude the impact
of a $14.5 million decrease to cost of revenues related to the settlement of the UK self-employment matter and that adjusts the
consolidated statements of income for fiscal 2009 to exclude $32.5 million in cost of revenues for the impact of the UK self-employment
matter and the $5.5 million impact of restructuring charges.
(2) “As adjusted” is a non-GAAP financial measure that adjusts the consolidated statements of net income for fiscal 2010 to exclude the
benefit of a $2.0 million increase to revenues from the reversal of the previously disclosed over-accrual related to the adverse UK VAT
ruling.
See “Non-GAAP Financial Measures” below for an explanation of our use of non-GAAP financial measures.
In the period from fiscal 2009 through fiscal 2013 our operating income margin ranged from a high of
29.8% in fiscal 2011 to a low of 25.2% in fiscal 2009. Excluding the impact of the UK VAT and UK self-
employment matters and the impact of our previously reported restructuring charges in the period, our operating
income margin ranged from a high of 29.8% in fiscal 2011 to a low of 26.5% in fiscal 2010. In fiscal 2010, the
operating income margin of the Company was driven by significant investment for the preparation and launch of
the PointsPlus program in the United States and Canada and ProPoints program in the United Kingdom and
Australia, increased marketing for our WeightWatchers.com business, and a charge associated with the
settlement of a California labor litigation.
In fiscal 2011, the operating income margin of the Company was 29.8%, the highest in the five-year period.
This was despite the increased marketing in WeightWatchers.com stemming from the initiative focused on
building awareness and relevance of the Weight Watchers brand with the male demographic, as well as expenses
in support of growth initiatives, including technology for the development of our mobile platforms and additions
to staff in support of business development. These higher expenses were more than offset by the efficiencies we
gained from higher average attendance in our meetings and the impact of the higher margin
WeightWatchers.com business becoming a larger component of our revenue mix.
40