WeightWatchers 2013 Annual Report Download - page 69
Download and view the complete annual report
Please find page 69 of the 2013 WeightWatchers annual report below. You can navigate through the pages in the report by either clicking on the pages listed below, or by using the keyword search tool below to find specific information within the annual report.-
 1
1 -
2
-
3
-
4
-
5
-
6
-
7
-
8
-
9
-
10
-
11
-
12
-
13
-
14
-
15
-
16
-
17
-
18
-
19
-
20
-
21
-
22
-
23
-
24
-
25
-
26
-
27
-
28
-
29
-
30
-
31
-
32
-
33
-
34
-
35
-
36
-
37
-
38
-
39
-
40
-
41
-
42
-
43
-
44
-
45
-
46
-
47
-
48
-
49
-
50
-
51
-
52
-
53
-
54
-
55
-
56
-
57
-
58
-
 59
59 -
 60
60 -
 61
61 -
 62
62 -
 63
63 -
 64
64 -
 65
65 -
 66
66 -
 67
67 -
 68
68 -
 69
69 -
 70
70 -
 71
71 -
 72
72 -
 73
73 -
 74
74 -
 75
75 -
 76
76 -
 77
77 -
 78
78 -
 79
79 -
80
-
81
-
82
-
83
-
84
-
85
-
86
-
87
-
88
-
89
-
90
-
91
-
92
-
93
-
94
-
95
-
96
-
97
-
98
-
99
-
100
-
101
-
102
-
103
-
104
-
105
-
106
-
107
-
108
-
109
-
110
-
111
-
112
-
113
-
114
-
115
-
116
-
117
-
118
-
119
-
120
-
121
-
122
-
123
-
124
-
125
-
126
-
127
-
128
-
129
-
130
-
131
-
132
-
133
-
134
-
135
-
136
-
137
-
138
 |
 |
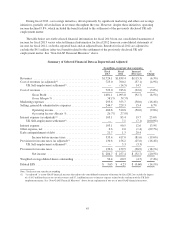
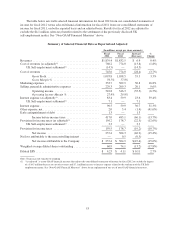
versus the prior year. This decline was primarily the result of an increase in marketing investments and selling,
general and administrative expenses in fiscal 2012 versus the prior year. As adjusted for the settlement, our gross
margin in fiscal 2012 increased to 58.7% from 57.8% in fiscal 2011, but operating income margin in fiscal 2012
declined to 27.0% from 29.8% in fiscal 2011. See “—Components of Expenses and Margins” for additional
details.
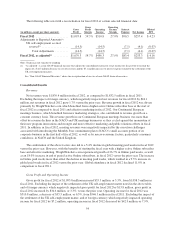
Net Income and Earnings Per Share
Net income attributable to the Company in fiscal 2012 declined 15.6% from $304.9 million in fiscal 2011 to
$257.4 million. Excluding the impact of the settlement of the UK self-employment matter noted in the table
above, net income attributable to the Company would have been $253.3 million in fiscal 2012, a decline of
16.9%. In addition to the decline in operating income, higher interest expense resulting from our financing of our
repurchase of shares in the Tender Offer and related share repurchase from Artal Holdings and a higher tax rate
further reduced net income in fiscal 2012. See “—Components of Expenses and Margins—Tax” for additional
details on our higher tax rate in fiscal 2012.
Earnings per fully diluted share in fiscal 2012 were $4.23, an increase of $0.11 from $4.11 in fiscal 2011.
Excluding the impact of the UK self-employment matter noted in the table above, earnings per fully diluted share
would have been $4.16, an increase of $0.05 or 1.1%. Earnings per fully diluted share in fiscal 2012, except for
the first quarter of fiscal 2012, benefited from our repurchase of shares in the Tender Offer and the related share
repurchase from Artal Holdings as our weighted average diluted shares outstanding for fiscal 2012 decreased to
60.9 million from 74.1 million in the prior year. See “—Liquidity and Capital Resources—Stock Transactions”
for a description of the Tender Offer and related share repurchase from Artal Holdings.
Components of Revenue and Volumes
We derive our revenues principally from meeting fees, Internet revenues, products sold in meetings, and
licensed products sold in retail channels. In addition, we generate other revenue from royalties paid to us by our
franchisees, subscriptions to our branded magazines, and advertising in our publications.
Meeting Fees
Global meeting fees for fiscal 2012 were $934.9 million, a decrease of $55.4 million, or 5.6%, from $990.3
million in the prior year. Excluding the impact of foreign currency, which decreased our global meeting fees for
fiscal 2012 by $12.2 million, global meeting fees in fiscal 2012 decreased by 4.4% versus the prior year. The
decline in meeting fees was driven by a 5.4% decline in global meeting paid weeks in fiscal 2012 to 99.2 million
from 104.8 million in the prior year. The decline in meeting paid weeks was driven by lower enrollments in fiscal
2012 as compared to the high enrollment levels in the prior year. However, the impact of enrollments on meeting
paid weeks was minimized by the higher meeting membership base at the beginning of fiscal 2012 versus the
beginning of fiscal 2011. Global attendance decreased 11.0% to 50.7 million in fiscal 2012 from 57.0 million in
fiscal 2011.
In NACO, meeting fees in fiscal 2012 were $653.4 million, a decrease of $33.4 million, or 4.9%, from
$686.8 million in fiscal 2011. The decline in meeting fees was driven primarily by a 5.6% decline in NACO
meeting paid weeks from 69.9 million in fiscal 2011 to 66.0 million in fiscal 2012. The decline in meeting paid
weeks primarily resulted from lower enrollments in fiscal 2012 as compared to the high enrollment levels in the
prior year. Lower enrollments in fiscal 2012 were driven in part by the execution challenges associated with
introducing Monthly Pass to the small accounts portion of NACO’s corporate business. However, the impact of
enrollments on meeting paid weeks was minimized by the higher meeting membership base at the beginning of
fiscal 2012 versus the beginning of fiscal 2011. In fiscal 2012, NACO attendance decreased 11.4% to
31.9 million from 36.0 million in fiscal 2011. Franchise acquisitions had a de minimis impact on NACO meeting
fees and metrics in fiscal 2012.
55