WeightWatchers 2013 Annual Report Download - page 59
Download and view the complete annual report
Please find page 59 of the 2013 WeightWatchers annual report below. You can navigate through the pages in the report by either clicking on the pages listed below, or by using the keyword search tool below to find specific information within the annual report.-
 1
1 -
2
-
3
-
4
-
5
-
6
-
7
-
8
-
9
-
10
-
11
-
12
-
13
-
14
-
15
-
16
-
17
-
18
-
19
-
20
-
21
-
22
-
23
-
24
-
25
-
26
-
27
-
28
-
29
-
30
-
31
-
32
-
33
-
34
-
35
-
36
-
37
-
38
-
39
-
40
-
41
-
42
-
43
-
44
-
45
-
46
-
47
-
48
-
 49
49 -
 50
50 -
 51
51 -
 52
52 -
 53
53 -
 54
54 -
 55
55 -
 56
56 -
 57
57 -
 58
58 -
 59
59 -
 60
60 -
 61
61 -
 62
62 -
 63
63 -
 64
64 -
 65
65 -
 66
66 -
 67
67 -
 68
68 -
 69
69 -
70
-
71
-
72
-
73
-
74
-
75
-
76
-
77
-
78
-
79
-
80
-
81
-
82
-
83
-
84
-
85
-
86
-
87
-
88
-
89
-
90
-
91
-
92
-
93
-
94
-
95
-
96
-
97
-
98
-
99
-
100
-
101
-
102
-
103
-
104
-
105
-
106
-
107
-
108
-
109
-
110
-
111
-
112
-
113
-
114
-
115
-
116
-
117
-
118
-
119
-
120
-
121
-
122
-
123
-
124
-
125
-
126
-
127
-
128
-
129
-
130
-
131
-
132
-
133
-
134
-
135
-
136
-
137
-
138
 |
 |

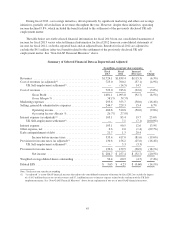
During fiscal 2013, cost savings initiatives, driven primarily by significant marketing and other cost savings
initiatives, partially offset declines in revenues throughout the year. However, despite these initiatives, operating
income declined 9.8%, which included the benefit related to the settlement of the previously disclosed UK self-
employment matter.
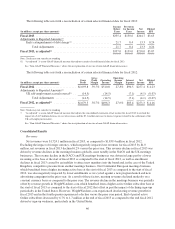
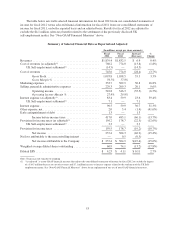
The table below sets forth selected financial information for fiscal 2013 from our consolidated statements of
income for fiscal 2013 versus selected financial information for fiscal 2012 from our consolidated statements of
income for fiscal 2012, on both a reported basis and an adjusted basis. Results for fiscal 2012 are adjusted to
exclude the $4.1 million (after-tax) benefit related to the settlement of the previously disclosed UK self-
employment matter. See “Non-GAAP Financial Measures” above.
Summary of Selected Financial Data as Reported and Adjusted
(In millions, except per share amounts)
Fiscal Fiscal Increase/ %
2013 2012 (Decrease) Change
Revenues ............................................. $1,724.1 $1,839.4 $(115.3) (6.3%)
Cost of revenues (as adjusted)(1) ........................... 723.0 760.2 (37.1) (4.9%)
UK Self-employment settlement(1) ...................... — (14.5) 14.5
Cost of revenues ........................................ 723.0 745.6 (22.6) (3.0%)
Gross Profit ................................... 1,001.1 1,093.8 (92.7) (8.5%)
Gross Margin % ................................ 58.1% 59.5%
Marketing expenses ..................................... 295.6 353.7 (58.0) (16.4%)
Selling, general & administrative expenses ................... 244.7 229.3 15.4 6.7%
Operating income ............................... 460.8 510.8 (50.0) (9.8%)
Operating Income Margin % ...................... 26.7% 27.8%
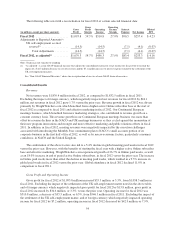
Interest expense (as adjusted)(1) ............................ 103.1 83.4 19.7 23.6%
UK Self-employment settlement(1) ...................... — 7.1 (7.1) (100.0%)
Interest expense ........................................ 103.1 90.5 12.6 13.9%
Other expense, net ...................................... 0.6 2.0 (1.4) (69.7%)
Early extinguishment of debt .............................. 21.7 1.3 20.4
Income before income taxes ...................... 335.4 417.0 (81.6) (19.6%)
Provision for income taxes (as adjusted)(1) ................... 130.6 156.2 (25.6) (16.4%)
UK Self-employment settlement(1) ...................... — 3.3 (3.3)
Provision for income taxes ................................ 130.6 159.5 (28.9) (18.1%)
Net income ................................... $ 204.7 $ 257.4 $ (52.7) (20.5%)
Weighted average diluted shares outstanding ................. 56.4 60.9 (4.5) (7.4%)
Diluted EPS ........................................... $ 3.63 $ 4.23 $ (0.60) (14.1%)
Note: Totals may not sum due to rounding
(1) “As adjusted” is a non-GAAP financial measure that adjusts the consolidated statements of income for fiscal 2012 to exclude the impact
of a $14.5 million decrease to cost of revenues and $7.1 million increase to interest expense related to the settlement of the UK Self-
employment matter. See “Non-GAAP Financial Measures” above for an explanation of our use of non-GAAP financial measures.
45