WeightWatchers 2013 Annual Report Download - page 47
Download and view the complete annual report
Please find page 47 of the 2013 WeightWatchers annual report below. You can navigate through the pages in the report by either clicking on the pages listed below, or by using the keyword search tool below to find specific information within the annual report.-
 1
1 -
2
-
3
-
4
-
5
-
6
-
7
-
8
-
9
-
10
-
11
-
12
-
13
-
14
-
15
-
16
-
17
-
18
-
19
-
20
-
21
-
22
-
23
-
24
-
25
-
26
-
27
-
28
-
29
-
30
-
31
-
32
-
33
-
34
-
35
-
36
-
 37
37 -
 38
38 -
 39
39 -
 40
40 -
 41
41 -
 42
42 -
 43
43 -
 44
44 -
 45
45 -
 46
46 -
 47
47 -
 48
48 -
 49
49 -
 50
50 -
 51
51 -
 52
52 -
 53
53 -
 54
54 -
 55
55 -
 56
56 -
 57
57 -
58
-
59
-
60
-
61
-
62
-
63
-
64
-
65
-
66
-
67
-
68
-
69
-
70
-
71
-
72
-
73
-
74
-
75
-
76
-
77
-
78
-
79
-
80
-
81
-
82
-
83
-
84
-
85
-
86
-
87
-
88
-
89
-
90
-
91
-
92
-
93
-
94
-
95
-
96
-
97
-
98
-
99
-
100
-
101
-
102
-
103
-
104
-
105
-
106
-
107
-
108
-
109
-
110
-
111
-
112
-
113
-
114
-
115
-
116
-
117
-
118
-
119
-
120
-
121
-
122
-
123
-
124
-
125
-
126
-
127
-
128
-
129
-
130
-
131
-
132
-
133
-
134
-
135
-
136
-
137
-
138
 |
 |

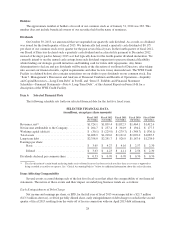
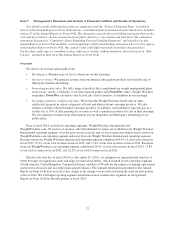
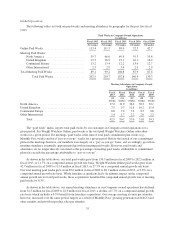
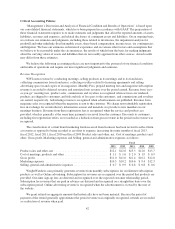
The following table sets forth our revenues by category for the past five fiscal years.
Revenue Sources
(in millions)
Fiscal 2013 Fiscal 2012 Fiscal 2011 Fiscal 2010 Fiscal 2009
(52 weeks) (52 weeks) (52 weeks) (52 weeks) (52 weeks)
Meetings fees ................................ $ 851.6 $ 934.9 $ 990.3 $ 819.6 $ 817.5
Internet revenues ............................. 522.2 504.3 399.5 238.8 196.0
In-meeting product sales ....................... 212.0 253.2 281.8 260.5 251.4
Licensing, franchise royalties and other ........... 138.3 147.0 160.9 145.2 147.7
Total ....................................... $1,724.1 $1,839.4 $1,832.5 $1,464.1 $1,412.6
From fiscal 2009 through fiscal 2013, our revenues increased at a compound annual growth rate of 5.1%
primarily driven by paid weeks growth in the WeightWatchers.com business. Additional revenue details are as
follows:
•Meeting fees. From fiscal 2009 through fiscal 2013, meeting fees grew at a compound annual growth
rate of 1.0%, with growth in our NACO meetings business being partially offset by declines in our UK
and Continental European meetings businesses. This increase was driven by growth in our meeting
paid weeks, which grew on a global basis at a compound annual growth rate of 0.6%. Beginning in
NACO in the second quarter of fiscal 2010, year-over-year growth in recruitment trends, driven by
strong new marketing and further fueled by the soft launch in the fourth quarter of fiscal 2010 of
PointsPlus and ProPoints in our English-speaking markets, drove global meeting fees by the fourth
quarter of fiscal 2010 to increase versus the comparable prior year period. The momentum of the new
program launches in our English-speaking markets accelerated our recruitment trends in the first
quarter of fiscal 2011, and, supported by strong marketing and public relations, resulted in global
meeting fees that increased in every quarter of fiscal 2011 as compared to the respective prior year
period. Fiscal 2012 had the challenge of being compared against the high levels of recruitment growth
we experienced in fiscal 2011. Although we entered fiscal 2012 with a higher meeting membership
base than we had at the beginning of fiscal 2011, lower enrollments in all 2012 fiscal quarters resulted
in lower meeting fees for the year as compared to the prior year. Lower enrollments in the meetings
business in fiscal 2012 were primarily driven by a decline in the English-speaking markets as we
cycled against the momentum of their program innovations in the prior year. Despite the global
introduction of the new Weight Watchers 360º plan, enrollments continued to decline in each fiscal
2013 quarter as compared to the prior year period. This negative enrollment trend coupled with a lower
meetings active base at the beginning of fiscal 2013 versus the beginning of fiscal 2012 drove a further
decline in meeting paid weeks in fiscal 2013 as compared to the prior year.
•Internet revenues. From fiscal 2009 through fiscal 2013, our Internet revenues grew at a compound
annual growth rate of 27.8%. The increase was primarily due to growth in the number of
WeightWatchers.com end of period active Online subscribers which grew by over 900,000 subscribers
from 762,660 at the end of fiscal 2009 to 1,746,182 at the end of fiscal 2013. This increase in Online
subscribers drove growth in our Online paid weeks, which grew at a compound annual growth rate of
27.7% during that period. This increase in Online subscribers and paid weeks, which accelerated in
fiscal 2011, was driven primarily by continued strong marketing campaigns which began in the second
quarter of fiscal 2010 in the United States and the United Kingdom, and further benefited from the new
program launches at the end of fiscal 2010. In addition, from fiscal 2009 through fiscal 2011, we had
three new country launches which further drove growth in our subscriber base. In fiscal 2012, first-time
dedicated television advertising coupled with effective marketing campaigns in Canada and
Continental Europe primarily drove strong Online paid weeks growth in the year. Although our active
Online subscriber base had a declining growth trend throughout fiscal 2012 which drove declining
33