WeightWatchers 2013 Annual Report Download - page 52
Download and view the complete annual report
Please find page 52 of the 2013 WeightWatchers annual report below. You can navigate through the pages in the report by either clicking on the pages listed below, or by using the keyword search tool below to find specific information within the annual report.-
 1
1 -
2
-
3
-
4
-
5
-
6
-
7
-
8
-
9
-
10
-
11
-
12
-
13
-
14
-
15
-
16
-
17
-
18
-
19
-
20
-
21
-
22
-
23
-
24
-
25
-
26
-
27
-
28
-
29
-
30
-
31
-
32
-
33
-
34
-
35
-
36
-
37
-
38
-
39
-
40
-
41
-
 42
42 -
 43
43 -
 44
44 -
 45
45 -
 46
46 -
 47
47 -
 48
48 -
 49
49 -
 50
50 -
 51
51 -
 52
52 -
 53
53 -
 54
54 -
 55
55 -
 56
56 -
 57
57 -
 58
58 -
 59
59 -
 60
60 -
 61
61 -
 62
62 -
63
-
64
-
65
-
66
-
67
-
68
-
69
-
70
-
71
-
72
-
73
-
74
-
75
-
76
-
77
-
78
-
79
-
80
-
81
-
82
-
83
-
84
-
85
-
86
-
87
-
88
-
89
-
90
-
91
-
92
-
93
-
94
-
95
-
96
-
97
-
98
-
99
-
100
-
101
-
102
-
103
-
104
-
105
-
106
-
107
-
108
-
109
-
110
-
111
-
112
-
113
-
114
-
115
-
116
-
117
-
118
-
119
-
120
-
121
-
122
-
123
-
124
-
125
-
126
-
127
-
128
-
129
-
130
-
131
-
132
-
133
-
134
-
135
-
136
-
137
-
138
 |
 |
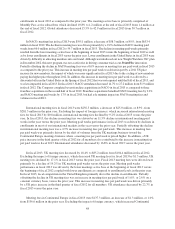
the first quarter of fiscal 2011 and resulted in a decline in meeting paid weeks. This declining trend continued
throughout the rest of fiscal 2012 and was negatively impacted by an advertising campaign that was ineffective at
driving enrollment growth and weak macro-economic trends.
In fiscal 2013, meeting paid weeks declined 19.2% and attendances decreased 22.7% versus the prior year
level. Meeting paid weeks negative performance in fiscal 2013 was driven by the lower meetings active base at
the beginning of fiscal 2013 versus the beginning of fiscal 2012 coupled with lower enrollments in the period as
compared to enrollment levels in the prior year. In fiscal 2013, local competition in the United Kingdom
significantly contributed to the decline in enrollments. For the first, second, third and fourth quarters of fiscal
2013, meeting paid weeks declined 17.8%, 19.0%, 21.1% and 19.4%, and attendances declined 25.8%, 20.3%,
22.7% and 20.5%, respectively, as compared to the prior year periods.
Continental Europe Meeting Metrics and Business Trends
In fiscal 2009, most of our Continental European markets were deeply affected by difficult recessionary
conditions. While Continental Europe experienced meeting paid weeks growth of 1.6% versus the prior year as
the market continued to benefit from increased Monthly Pass penetration, attendance declined 11.8% versus the
prior year. A major new innovative program, ProPoints, was launched in the fourth quarter of fiscal 2009.
In fiscal 2010, meeting paid weeks, benefiting from enrollment growth early in the year and an increase in
Monthly Pass penetration, grew 6.9% versus the prior year, while attendance in Continental Europe declined
1.6% versus the prior year. In the first half of fiscal 2010, the Continental European market experienced
attendance growth as a result of the ProPoints program launch in fiscal 2009, which drove an influx of returning
members to our meetings. The marketing of this new program, however, was not successful in capturing the
attention of new members and, as a result, attendance began to decline in the third quarter of fiscal 2010.
Entering fiscal 2011, Continental European performance continued its downward trend, with meeting paid
weeks down 9.8% versus the prior year and attendances down 15.4% versus the prior year. In the first half of
fiscal 2011, meeting paid weeks declined by 13.1% and attendance declined by 18.9% versus the prior year
period, as the business lapped the momentum of its program launch in the prior year. While still negative versus
the prior year period, the trend began to improve in the third quarter of fiscal 2011 with meeting paid weeks
down 6.0% and attendances down 15.1%. In the fourth quarter of fiscal 2011, Continental Europe soft launched
its updated version of ProPoints in December, resulting in a less negative performance with meeting paid weeks
down 4.9% and attendances down 4.3% versus the prior year period.
In fiscal 2012, meeting paid weeks grew 9.2%, and attendances grew 3.3%, versus the prior year. This
growth was driven by entering fiscal 2012 with a higher active member base than the prior year and the benefit of
higher enrollment growth from the launch of the updated version of ProPoints in late fiscal 2011 and early fiscal
2012, effective new marketing strategies and an increase in Monthly Pass penetration. For the first, second, third
and fourth quarters of fiscal 2012, meeting paid weeks grew 5.4%, 11.0%, 12.1% and 9.0%, and attendances
grew 4.3%, 2.7%, 4.9% and 1.0%, respectively, as compared to the prior year periods.
In fiscal 2013, meeting paid weeks declined 1.5%, and attendances declined 8.1%, versus the prior year.
This decrease in meeting paid weeks was driven by lower enrollments in fiscal 2013 as compared to the prior
year. Lower enrollments were the result of cycling against the successful launch of the updated program and the
new advertising campaigns in the prior year period. However, the negative impact of enrollments on meeting
paid weeks was minimized by the higher meetings active base at the beginning of fiscal 2013 versus the
beginning of fiscal 2012. For the first, second, third and fourth quarters of fiscal 2013, meeting paid weeks
declined 1.0%, 1.6%, 1.7% and 1.7%, and attendances declined 10.9%, 6.7%, 8.2% and 5.7%, respectively, as
compared to the prior year periods.
38