WeightWatchers 2013 Annual Report Download - page 71
Download and view the complete annual report
Please find page 71 of the 2013 WeightWatchers annual report below. You can navigate through the pages in the report by either clicking on the pages listed below, or by using the keyword search tool below to find specific information within the annual report.-
 1
1 -
2
-
3
-
4
-
5
-
6
-
7
-
8
-
9
-
10
-
11
-
12
-
13
-
14
-
15
-
16
-
17
-
18
-
19
-
20
-
21
-
22
-
23
-
24
-
25
-
26
-
27
-
28
-
29
-
30
-
31
-
32
-
33
-
34
-
35
-
36
-
37
-
38
-
39
-
40
-
41
-
42
-
43
-
44
-
45
-
46
-
47
-
48
-
49
-
50
-
51
-
52
-
53
-
54
-
55
-
56
-
57
-
58
-
59
-
60
-
 61
61 -
 62
62 -
 63
63 -
 64
64 -
 65
65 -
 66
66 -
 67
67 -
 68
68 -
 69
69 -
 70
70 -
 71
71 -
 72
72 -
 73
73 -
 74
74 -
 75
75 -
 76
76 -
 77
77 -
 78
78 -
 79
79 -
 80
80 -
 81
81 -
82
-
83
-
84
-
85
-
86
-
87
-
88
-
89
-
90
-
91
-
92
-
93
-
94
-
95
-
96
-
97
-
98
-
99
-
100
-
101
-
102
-
103
-
104
-
105
-
106
-
107
-
108
-
109
-
110
-
111
-
112
-
113
-
114
-
115
-
116
-
117
-
118
-
119
-
120
-
121
-
122
-
123
-
124
-
125
-
126
-
127
-
128
-
129
-
130
-
131
-
132
-
133
-
134
-
135
-
136
-
137
-
138
 |
 |
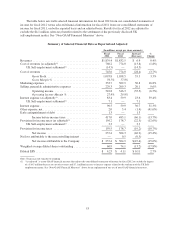
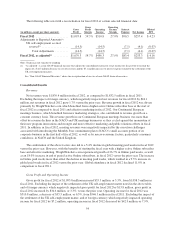
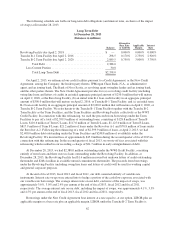
Internet Revenues
Internet revenues, which include subscription revenues from sales of our Weight Watchers Online and
Weight Watchers eTools products as well as Internet advertising revenues, increased $104.8 million, or 26.2%, to
$504.3 million in fiscal 2012 from $399.5 million in fiscal 2011. Excluding the impact of foreign currency,
which decreased Internet revenues for fiscal 2012 by $5.9 million, Internet revenues grew by 27.7% in fiscal
2012 versus the prior year. The combination of a higher active Online subscriber base at the start of fiscal 2012,
up 50.5%, versus the beginning of fiscal 2011, and effective marketing campaigns in North America and
Continental Europe contributed to Online paid weeks growth of 26.7% in fiscal 2012 versus the prior year.
Additionally, end of period active Online subscribers increased by 18.0% to 1.9 million at the end of fiscal 2012
as compared to 1.6 million at the end of fiscal 2011.
Other Revenues
Other revenues, comprised primarily of licensing revenues, franchise royalties, revenues from the sale of
products by mail and to our franchisees, and revenues from our publications, were $146.9 million for fiscal 2012,
a decrease of $14.0 million, or 8.7%, from $160.9 million for fiscal 2011. Excluding the impact of foreign
currency, which decreased other revenues for fiscal 2012 by $1.5 million, other revenues were 7.7% lower in
fiscal 2012 compared to the prior year. Franchise commissions and sales of products to our franchisees declined
in the aggregate by 22.4%, or 21.9% on a constant currency basis, in fiscal 2012 versus the prior year. Our by
mail product sales and revenues from our publications also declined in the aggregate by 14.3%, or 12.9% on a
constant currency basis, in fiscal 2012 versus the prior year. These declines were primarily the result of
comparing against the prior year which had the benefit of the new program launches in our English-speaking
markets in late fiscal 2010. Global licensing revenues increased by 1.5%, or 2.2% on a constant currency basis, in
fiscal 2012 versus the prior year. A one-time termination fee in the second quarter of fiscal 2012 which was
included in licensing revenues primarily accounted for the increase. Excluding this one-time termination fee of
$2.0 million from licensing revenues, global licensing revenues in fiscal 2012 decreased 0.5% on a constant
currency basis versus the prior year.
Components of Expenses and Margins
Cost of Revenues and Gross Margin
Excluding the impact of the settlement of the UK self-employment matter, cost of revenues in fiscal 2012
would have been $760.2 million, a decline of $13.8 million, or 1.8%, from $774.0 million in the prior year. Cost
of revenues declined due to the shift of revenue towards the higher margin WeightWatchers.com business. As
adjusted for the settlement, gross profit in fiscal 2012 of $1,079.3 million increased $20.8 million, or 2.0%, from
$1,058.5 million in fiscal 2011. Adjusted gross margin in fiscal 2012 was 58.7%, as compared to 57.8% in fiscal
2011. Gross margin expansion was primarily the result of the shift of revenue towards the higher margin
WeightWatchers.com business. This margin expansion was partially offset by a decline in the meetings business
gross margin. This decline in the meetings business gross margin was primarily driven by the impact of higher
costs associated with our future growth initiatives and lower average number of members per meeting.
Marketing
Marketing expenses for fiscal 2012 were $353.7 million, an increase of $50.8 million, or 16.8%, versus
fiscal 2011. Excluding the impact of foreign currency, which decreased marketing expenses for fiscal 2012 by
$4.2 million, marketing expenses were 18.1% higher in fiscal 2012 compared to the prior year. Included in our
fiscal 2012 marketing expenses were investments in two initiatives: first time Online TV marketing campaigns in
several of our international markets and marketing the Weight Watchers Online product to men in the United
States. In addition, we invested in TV advertising for Continental Europe’s meetings business, which also
contributed to the increase in marketing expenses in fiscal 2012. The increase in marketing expenses also
reflected the impact of higher volumes on online advertising costs. Marketing expenses as a percentage of
revenue were 19.2% in fiscal 2012 as compared to 16.5% in the prior year.
57