WeightWatchers 2013 Annual Report Download - page 66
Download and view the complete annual report
Please find page 66 of the 2013 WeightWatchers annual report below. You can navigate through the pages in the report by either clicking on the pages listed below, or by using the keyword search tool below to find specific information within the annual report.-
 1
1 -
2
-
3
-
4
-
5
-
6
-
7
-
8
-
9
-
10
-
11
-
12
-
13
-
14
-
15
-
16
-
17
-
18
-
19
-
20
-
21
-
22
-
23
-
24
-
25
-
26
-
27
-
28
-
29
-
30
-
31
-
32
-
33
-
34
-
35
-
36
-
37
-
38
-
39
-
40
-
41
-
42
-
43
-
44
-
45
-
46
-
47
-
48
-
49
-
50
-
51
-
52
-
53
-
54
-
55
-
 56
56 -
 57
57 -
 58
58 -
 59
59 -
 60
60 -
 61
61 -
 62
62 -
 63
63 -
 64
64 -
 65
65 -
 66
66 -
 67
67 -
 68
68 -
 69
69 -
 70
70 -
 71
71 -
 72
72 -
 73
73 -
 74
74 -
 75
75 -
 76
76 -
77
-
78
-
79
-
80
-
81
-
82
-
83
-
84
-
85
-
86
-
87
-
88
-
89
-
90
-
91
-
92
-
93
-
94
-
95
-
96
-
97
-
98
-
99
-
100
-
101
-
102
-
103
-
104
-
105
-
106
-
107
-
108
-
109
-
110
-
111
-
112
-
113
-
114
-
115
-
116
-
117
-
118
-
119
-
120
-
121
-
122
-
123
-
124
-
125
-
126
-
127
-
128
-
129
-
130
-
131
-
132
-
133
-
134
-
135
-
136
-
137
-
138
 |
 |
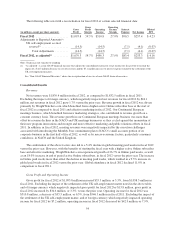
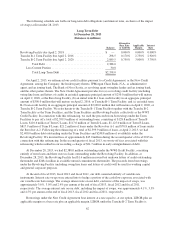
RESULTS OF OPERATIONS FOR FISCAL 2012 (52 weeks) COMPARED TO FISCAL 2011 (52 weeks)
OVERVIEW
Fiscal 2011 was a year of revenue and volume growth in all fiscal quarters as compared to the prior year
periods. We experienced accelerated period-over-period volume growth in our North American and UK meetings
and Weight Watchers.com businesses throughout the year. The momentum of our new program launches,
PointsPlus in North America and ProPoints in our other English-speaking markets, and strong marketing and
public relations efforts drove this accelerated growth and historically high volumes in fiscal 2011.
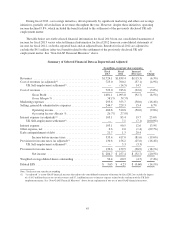
Fiscal 2012 had the challenge of being compared against the high levels of recruitment growth and related
results of fiscal 2011. Fiscal 2012 versus the prior year had similar performance trends as each of the individual
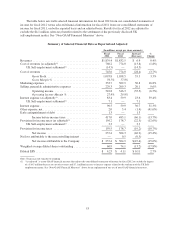
fiscal 2012 quarters. Net revenues were $1,839.4 million in fiscal 2012, as compared to $1,832.5 million in fiscal
2011. Growth in Internet revenues in fiscal 2012 versus the prior year was almost fully offset by revenue declines
in the meetings business. Gross margin for fiscal 2012 grew to 59.5%, including an 80 basis point benefit from
the accrual reversal associated with the settlement of the UK self-employment matter, from 57.8% in fiscal 2011.
Both marketing expenses and selling, general and administrative expenses increased as a percentage of revenue
in fiscal 2012 versus the prior year due to our investments in growth initiatives. As a result, operating income
margin for fiscal 2012, which, like gross margin, also benefited by 80 basis points related to the accrual reversal
associated with the settlement of the UK self-employment matter, declined 2.0% to 27.8% from 29.8% in fiscal
2011. Consequently, and as a result of higher interest expense and a higher tax rate, net income attributable to the
Company in fiscal 2012 declined 15.6% versus the prior year to $257.4 million.
52