WeightWatchers 2013 Annual Report Download - page 108
Download and view the complete annual report
Please find page 108 of the 2013 WeightWatchers annual report below. You can navigate through the pages in the report by either clicking on the pages listed below, or by using the keyword search tool below to find specific information within the annual report.-
 1
1 -
2
-
3
-
4
-
5
-
6
-
7
-
8
-
9
-
10
-
11
-
12
-
13
-
14
-
15
-
16
-
17
-
18
-
19
-
20
-
21
-
22
-
23
-
24
-
25
-
26
-
27
-
28
-
29
-
30
-
31
-
32
-
33
-
34
-
35
-
36
-
37
-
38
-
39
-
40
-
41
-
42
-
43
-
44
-
45
-
46
-
47
-
48
-
49
-
50
-
51
-
52
-
53
-
54
-
55
-
56
-
57
-
58
-
59
-
60
-
61
-
62
-
63
-
64
-
65
-
66
-
67
-
68
-
69
-
70
-
71
-
72
-
73
-
74
-
75
-
76
-
77
-
78
-
79
-
80
-
81
-
82
-
83
-
84
-
85
-
86
-
87
-
88
-
89
-
90
-
91
-
92
-
93
-
94
-
95
-
96
-
97
-
 98
98 -
 99
99 -
 100
100 -
 101
101 -
 102
102 -
 103
103 -
 104
104 -
 105
105 -
 106
106 -
 107
107 -
 108
108 -
 109
109 -
 110
110 -
 111
111 -
 112
112 -
 113
113 -
 114
114 -
 115
115 -
 116
116 -
 117
117 -
 118
118 -
119
-
120
-
121
-
122
-
123
-
124
-
125
-
126
-
127
-
128
-
129
-
130
-
131
-
132
-
133
-
134
-
135
-
136
-
137
-
138
 |
 |

WEIGHT WATCHERS INTERNATIONAL, INC. AND SUBSIDIARIES
NOTES TO CONSOLIDATED FINANCIAL STATEMENTS
(IN THOUSANDS, EXCEPT PER SHARE AMOUNTS)
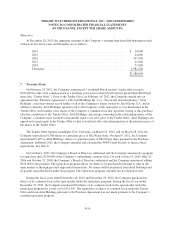
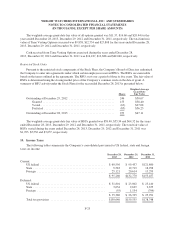
The fair value of each of these option awards is estimated on the date of grant using the Black-Scholes
option pricing model with the weighted average assumptions noted in the following table. Expected volatility is
based on the historical volatility of the Company’s stock. Since the Company’s option exercise history is limited,
it has estimated the expected term of these option grants to be the midpoint between the vesting period and the
contractual term of each award. The risk free interest rate is based on the U.S. Treasury yield curve in effect on
the date of grant which most closely corresponds to the expected term of the Time Vesting Options. The dividend
yield is based on our historic average dividend yield. For Time Vesting Options granted in the fourth quarter of
fiscal 2013, the dividend yield is zero because there is no longer a dividend.
December 28,
2013
December 29,
2012
December 31,
2011
Dividend yield ........................................... 0.8% 1.6% 1.8%
Volatility ............................................... 36.5% 35.5% 33.6%
Risk-free interest rate ..................................... 1.3% - 2.2% 1.0% - 1.4% 1.5% - 2.8%
Expected term (years) ..................................... 6.5 6.5 6.5
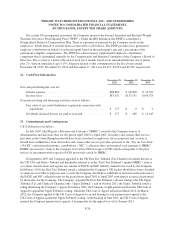
Option Awards with Time and Performance Vesting Criteria
Pursuant to the option components of the Stock Plans, the Company’s Board of Directors authorized the
Company to enter into agreements under which certain employees received stock options with both time and
performance vesting criteria (“T&P Vesting Options”). The options are exercisable based on the terms outlined
in the agreements. During the fourth quarter of fiscal 2013, the Company granted 686,549 T&P Vesting Options
to certain employees that will vest based on the achievement of both time and performance vesting criteria. The
time-vesting criteria will be 100% satisfied on the third anniversary of the date of the grant and the performance
criteria is contingent upon meeting or exceeding certain stock price hurdles. With respect to the performance-
vesting criteria, the stock options will fully vest in 20% increments upon the first date that the average closing
stock price for the 20 consecutive preceding trading days is equal to or greater than specified stock price
hurdles. The fair value of the T&P Vesting Options was estimated on the date of grant and was based on the
likelihood of the Company achieving the performance conditions. The Company estimated the fair value of the
T&P Vesting Options to be $8.46. The Company estimated this fair value using a Monte Carlo simulation that
used various assumptions that included expected volatility of 36.48%, a risk free rate of 1.55% and an expected
term of 3.0 years. Expected volatility was based on the historical volatility of the Company’s stock. The risk-free
interest rate was based on the U.S. Treasury yield curve in effect on the date of grant which most closely
corresponds to the performance measurement period. The expected term represents the period from the grant date
to the end of the five year performance period. Compensation expense on T&P Vesting Options is recognized
ratably over the three year required service period as this period is longer than the derived service period
calculated by the Monte Carlo simulation.
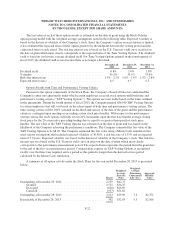
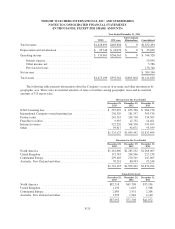
A summary of all option activity under the Stock Plans for the year ended December 28, 2013 is presented
below:
Shares
Weighted-
Average
Exercise
Price
Weighted-
Average
Remaining
Contractual
Life (Yrs.)
Aggregate
Intrinsic
Value
Outstanding at December 29, 2012 ............................ 2,239 $42.75
Granted ............................................. 1,551 $36.35
Exercised ............................................ (620) $26.09
Canceled ............................................ (957) $51.62
Outstanding at December 28, 2013 ............................ 2,213 $39.09 7.2 $2,372
Exercisable at December 28, 2013 ............................ 362 $32.03 5.5 $2,166
F-22