US Cellular 2009 Annual Report Download - page 91
Download and view the complete annual report
Please find page 91 of the 2009 US Cellular annual report below. You can navigate through the pages in the report by either clicking on the pages listed below, or by using the keyword search tool below to find specific information within the annual report.-
 1
1 -
2
-
3
-
4
-
5
-
6
-
7
-
8
-
9
-
10
-
11
-
12
-
13
-
14
-
15
-
16
-
17
-
18
-
19
-
20
-
21
-
22
-
23
-
24
-
25
-
26
-
27
-
28
-
29
-
30
-
31
-
32
-
33
-
34
-
35
-
36
-
37
-
38
-
39
-
40
-
41
-
42
-
43
-
44
-
45
-
46
-
47
-
48
-
49
-
50
-
51
-
52
-
53
-
54
-
55
-
56
-
57
-
58
-
59
-
60
-
61
-
62
-
63
-
64
-
65
-
66
-
67
-
68
-
69
-
70
-
71
-
72
-
73
-
74
-
75
-
76
-
77
-
78
-
79
-
80
-
 81
81 -
 82
82 -
 83
83 -
 84
84 -
 85
85 -
 86
86 -
 87
87 -
 88
88 -
 89
89 -
 90
90 -
 91
91 -
 92
92 -
 93
93 -
 94
94 -
 95
95 -
 96
96
 |
 |
19FEB201008550545
United States Cellular Corporation
SHAREHOLDER INFORMATION
Stock and dividend information
U.S. Cellular’s Common Shares are listed on the New York Stock Exchange under the symbol ‘‘USM’’
and in the newspapers as ‘‘US Cellu.’’ As of January 29, 2010, the last trading day of the month,
U.S. Cellular’s Common Shares were held by 378 record owners. All of the Series A Common Shares
were held by TDS. No public trading market exists for the Series A Common Shares. The Series A
Common Shares are convertible on a share-for-share basis into Common Shares.
U.S. Cellular has not paid any cash dividends and currently intends to retain all earnings for use in
U.S. Cellular’s business.
See ‘‘Consolidated Quarterly Information (Unaudited)’’ for information on the high and low trading prices
of the USM Common Shares for 2009 and 2008.
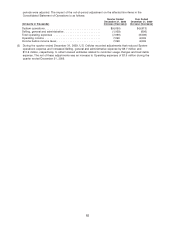
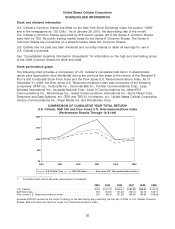
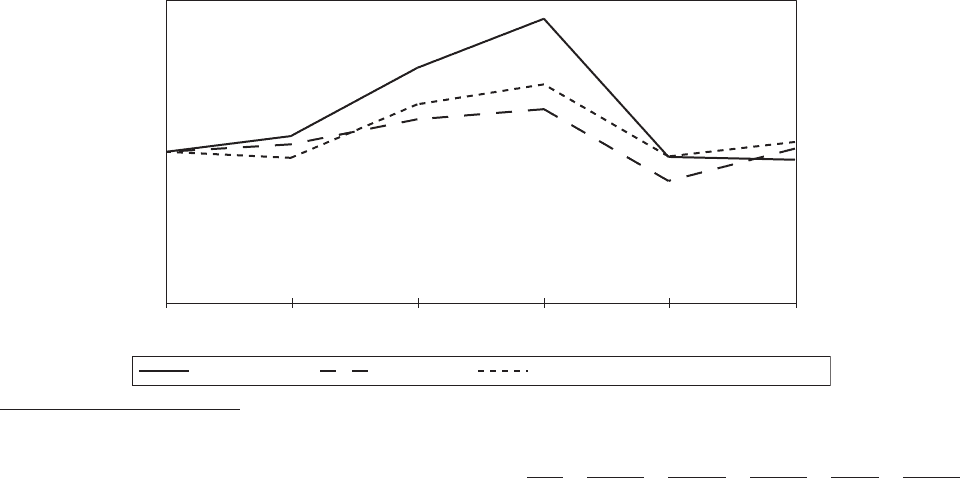
Stock performance graph
The following chart provides a comparison of U.S. Cellular’s cumulative total return to shareholders
(stock price appreciation plus dividends) during the previous five years to the returns of the Standard &
Poor’s 500 Composite Stock Price Index and the Dow Jones U.S. Telecommunications Index. As of
December 31, 2009, the Dow Jones U.S. Telecommunications Index was composed of the following
companies: AT&T Inc., CenturyTel Inc., Cincinnati Bell Inc., Frontier Communications Corp., Leap
Wireless International Inc., Leucadia National Corp., Level 3 Communications Inc., MetroPCS
Communications Inc., NII Holdings Inc., Qwest Communications International Inc., Sprint Nextel Corp.,
Telephone and Data Systems, Inc. (TDS and TDS.S), tw telecom, inc., United States Cellular Corporation,
Verizon Communications Inc., Virgin Media Inc. and Windstream Corp.
COMPARISON OF CUMULATIVE YEAR TOTAL RETURN*
U.S. Cellular, S&P 500 and Dow Jones U.S. Telecommunications Index
(Performance Results Through 12/31/09)
$0
$50
$100
$150
$200
2005 2006 2007 20082004 2009
U.S. Cellular Corp Dow Jones U.S. Telecommunications IndexS&P 500 Index
* Cumulative total returns assumes reinvestment of dividends.
2004 2005 2006 2007 2008 2009
U.S. Cellular .................................... $100 $110.37 $155.47 $187.89 $96.60 $ 94.75
S&P 500 Index ................................... 100 104.91 121.48 128.16 80.74 102.11
Dow Jones U.S. Telecommunications Index ................ 100 96.00 131.36 144.55 96.94 106.49
Assumes $100.00 invested at the close of trading on the last trading day preceding the first day of 2004 in U.S. Cellular Common
Shares, S&P 500 Index and the Dow Jones U.S. Telecommunications Index.
83