US Cellular 2009 Annual Report Download - page 31
Download and view the complete annual report
Please find page 31 of the 2009 US Cellular annual report below. You can navigate through the pages in the report by either clicking on the pages listed below, or by using the keyword search tool below to find specific information within the annual report.-
 1
1 -
2
-
3
-
4
-
5
-
6
-
7
-
8
-
9
-
10
-
11
-
12
-
13
-
14
-
15
-
16
-
17
-
18
-
19
-
20
-
 21
21 -
 22
22 -
 23
23 -
 24
24 -
 25
25 -
 26
26 -
 27
27 -
 28
28 -
 29
29 -
 30
30 -
 31
31 -
 32
32 -
 33
33 -
 34
34 -
 35
35 -
 36
36 -
 37
37 -
 38
38 -
 39
39 -
 40
40 -
 41
41 -
42
-
43
-
44
-
45
-
46
-
47
-
48
-
49
-
50
-
51
-
52
-
53
-
54
-
55
-
56
-
57
-
58
-
59
-
60
-
61
-
62
-
63
-
64
-
65
-
66
-
67
-
68
-
69
-
70
-
71
-
72
-
73
-
74
-
75
-
76
-
77
-
78
-
79
-
80
-
81
-
82
-
83
-
84
-
85
-
86
-
87
-
88
-
89
-
90
-
91
-
92
-
93
-
94
-
95
-
96
 |
 |

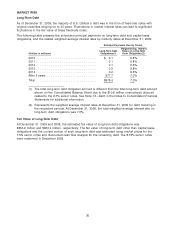
market participant perspective, the risks inherent in owning a specific wireless license are less than those
associated with owning and operating an entire wireless business.
The discount rate is the most significant assumption in both the MPECF method and the build-out
method. The discount rate is estimated based on the overall risk-free interest rate adjusted for industry
participant information, such as a typical capital structure (i.e., debt-equity ratio), the after-tax cost of debt
and the cost of equity. The cost of equity takes into consideration the average risk specific to individual
market participants and the specific risk to U.S. Cellular. The discount rates used for the licenses
impairment tests at December 31, 2008 (under the MPECF method) and November 1, 2009 (under the
build-out method) were 9.5% and 10.0%, respectively. The increase in the discount rate between these
two dates was primarily a result of the company-specific risk premium (‘‘CSRP’’) applied to the cost of
equity calculation. The selection of the higher CSRP was based on a variety of specific risk factors facing
U.S. Cellular including the risks associated with the underlying projections relative to the market and the
highly concentrated and competitive nature of the market.
The results of the licenses impairment test at November 1, 2009 resulted in the recognition of a loss on
impairment of $14.0 million. If the discount rate had increased by 1.0% to 11.0%, the impairment loss
would have increased by $657 million; if the discount rate had decreased by 1.0% to 9.0%, no
impairment loss would have been recognized.
Non-operating market licenses (‘‘unbuilt licenses’’)
For purposes of performing impairment testing of unbuilt licenses, U.S. Cellular prepares estimates of fair
value by reference to prices paid in recent auctions and market transactions where available. If such
information is not available, the fair value of the unbuilt licenses is assumed to have changed by the
same percentage, and in the same direction, that the fair value of built licenses measured using the
build-out method changed during the period. None of the $14.0 million total impairment loss recognized
as a result of the November 1, 2009 licenses impairment test related to unbuilt licenses.
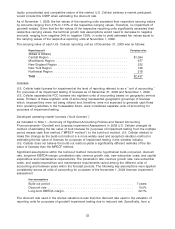
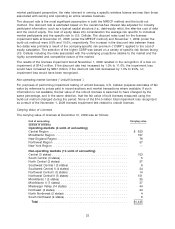
Carrying Value of Licenses
The carrying value of licenses at December 31, 2009 was as follows:
Unit of accounting Carrying value
(Dollars in millions)
Operating markets (5 units of accounting)
Central Region .......................................... $ 623
Mid-Atlantic Region ....................................... 197
New England Region ...................................... 76
Northwest Region ........................................ 57
New York Region ........................................ —
Non-operating markets (13 units of accounting)
Central (3 states) ......................................... 103
South Central (3 states) .................................... 5
North Central (3 states) .................................... 27
Southwest Central I (3 states) ............................... 8
Southwest Central II (4 states) ............................... 24
Northwest Central I (5 states) ................................ 14
Northwest Central II (5 states) ............................... 151
Mid-Atlantic I (3 states) .................................... 35
Mid-Atlantic II (7 states) .................................... 37
Mississippi Valley (14 states) ................................ 44
Northeast (4 states) ....................................... 24
North Northwest (2 states) .................................. 4
South Northwest (2 states) .................................. 6
Total ................................................ $1,435
23