US Cellular 2009 Annual Report Download - page 87
Download and view the complete annual report
Please find page 87 of the 2009 US Cellular annual report below. You can navigate through the pages in the report by either clicking on the pages listed below, or by using the keyword search tool below to find specific information within the annual report.-
 1
1 -
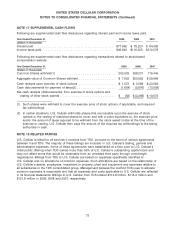
2
-
3
-
4
-
5
-
6
-
7
-
8
-
9
-
10
-
11
-
12
-
13
-
14
-
15
-
16
-
17
-
18
-
19
-
20
-
21
-
22
-
23
-
24
-
25
-
26
-
27
-
28
-
29
-
30
-
31
-
32
-
33
-
34
-
35
-
36
-
37
-
38
-
39
-
40
-
41
-
42
-
43
-
44
-
45
-
46
-
47
-
48
-
49
-
50
-
51
-
52
-
53
-
54
-
55
-
56
-
57
-
58
-
59
-
60
-
61
-
62
-
63
-
64
-
65
-
66
-
67
-
68
-
69
-
70
-
71
-
72
-
73
-
74
-
75
-
76
-
 77
77 -
 78
78 -
 79
79 -
 80
80 -
 81
81 -
 82
82 -
 83
83 -
 84
84 -
 85
85 -
 86
86 -
 87
87 -
 88
88 -
 89
89 -
 90
90 -
 91
91 -
 92
92 -
 93
93 -
 94
94 -
 95
95 -
 96
96
 |
 |

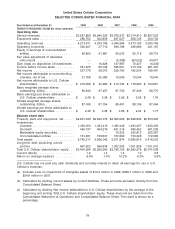
United States Cellular Corporation
SELECTED CONSOLIDATED FINANCIAL DATA
Year Ended or at December 31, 2009 2008 2007 2006 2005
(Dollars in thousands, except per share amounts)
Operating data
Service revenues .................. $3,927,859 $3,940,326 $3,679,237 $3,214,410 $2,827,022
Equipment sales ................... 286,752 302,859 267,027 258,745 203,743
Operating revenues ................ 4,214,611 4,243,185 3,946,264 3,473,155 3,030,765
Operating income(a) ................ 326,407 27,710 396,199 289,896 231,197
Equity in earnings of unconsolidated
entities ........................ 96,800 91,981 90,033 93,119 66,719
Fair value adjustment of derivative
instruments ..................... — — (5,388) (63,022) 44,977
Gain (loss) on disposition of investments . — 16,628 137,987 70,427 (6,203)
Income before income taxes .......... 351,879 66,128 546,501 313,138 261,347
Net income ...................... 237,776 58,073 329,790 192,534 165,491
Net income attributable to noncontrolling
interests, net of tax ............... 21,768 25,083 15,056 13,044 10,540
Net income attributable to U.S. Cellular
shareholders .................... $ 216,008 $ 32,990 $ 314,734 $ 179,490 $ 154,951
Basic weighted average shares
outstanding (000s) ................ 86,946 87,457 87,730 87,346 86,775
Basic earnings per share attributable to
U.S. Cellular shareholders .......... $ 2.48 $ 0.38 $ 3.59 $ 2.05 $ 1.79
Diluted weighted average shares
outstanding (000s) ................ 87,168 87,754 88,481 88,109 87,464
Diluted earnings per share attributable to
U.S. Cellular shareholders .......... $ 2.48 $ 0.38 $ 3.56 $ 2.04 $ 1.77
Balance sheet data
Property, plant and equipment, net ..... $2,601,338 $2,620,376 $2,595,096 $2,628,848 $2,553,029
Investments
Licenses ....................... 1,435,000 1,433,415 1,482,446 1,494,327 1,362,263
Goodwill ....................... 494,737 494,279 491,316 485,452 481,236
Marketable equity securities ......... — — 16,352 253,912 225,387
Unconsolidated entities ............ 161,481 156,637 157,693 150,325 172,093
Total assets ...................... 5,745,217 5,566,042 5,611,874 5,680,616 5,416,233
Long-term debt (excluding current
portion) ........................ 867,522 996,636 1,002,293 1,001,839 1,161,241
Total U.S. Cellular shareholders’ equity . . . $3,404,296 $3,206,642 $3,196,156 $2,993,279 $2,741,038
Current ratio(b) .................... 1.6 1.4 1.4 1.0 0.8
Return on average equity(c) .......... 6.5% 1.0% 10.2% 6.3% 5.8%
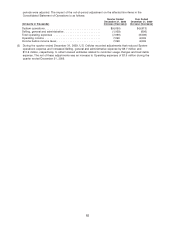
U.S. Cellular has not paid any cash dividends and currently intends to retain all earnings for use in U.S.
Cellular’s business.
(a) Includes Loss on impairment of intangible assets of $14.0 million in 2009, $386.7 million in 2008 and
$24.9 million in 2007.
(b) Calculated by dividing current assets by current liabilities. These amounts are taken directly from the
Consolidated Balance Sheet.
(c) Calculated by dividing Net income attributable to U.S. Cellular shareholders by the average of the
beginning and ending Total U.S. Cellular shareholders’ equity. These amounts are taken from the
Consolidated Statement of Operations and Consolidated Balance Sheet. The result is shown as a
percentage.
79