US Cellular 2009 Annual Report Download - page 17
Download and view the complete annual report
Please find page 17 of the 2009 US Cellular annual report below. You can navigate through the pages in the report by either clicking on the pages listed below, or by using the keyword search tool below to find specific information within the annual report.-
 1
1 -
2
-
3
-
4
-
5
-
6
-
 7
7 -
 8
8 -
 9
9 -
 10
10 -
 11
11 -
 12
12 -
 13
13 -
 14
14 -
 15
15 -
 16
16 -
 17
17 -
 18
18 -
 19
19 -
 20
20 -
 21
21 -
 22
22 -
 23
23 -
 24
24 -
 25
25 -
 26
26 -
 27
27 -
28
-
29
-
30
-
31
-
32
-
33
-
34
-
35
-
36
-
37
-
38
-
39
-
40
-
41
-
42
-
43
-
44
-
45
-
46
-
47
-
48
-
49
-
50
-
51
-
52
-
53
-
54
-
55
-
56
-
57
-
58
-
59
-
60
-
61
-
62
-
63
-
64
-
65
-
66
-
67
-
68
-
69
-
70
-
71
-
72
-
73
-
74
-
75
-
76
-
77
-
78
-
79
-
80
-
81
-
82
-
83
-
84
-
85
-
86
-
87
-
88
-
89
-
90
-
91
-
92
-
93
-
94
-
95
-
96
 |
 |
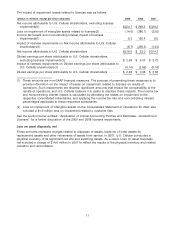
number of cell sites totaled 7,279 in 2009, 6,877 in 2008 and 6,383 in 2007, as U.S. Cellular continued
to grow by expanding and enhancing coverage in its existing markets. In 2008 and 2007, growth also
included acquisitions of existing wireless operations. The increase in 2009 and 2008 also was due to
an increase in software maintenance costs to support rapidly growing data needs.
• Expenses incurred when U.S. Cellular’s customers used other carriers’ networks while roaming
increased $4.3 million, or 2%, in 2009 and $28.0 million, or 17%, in 2008. The increase in 2009 was
due primarily to higher data usage. The increase in 2008 was due to an increase in roaming minutes
of use driven by customer migration to national and wide area plans.
• In 2009, the cost of network usage on U.S. Cellular’s systems decreased $6.1 million, or 2%, due
primarily to reduced interconnection costs, which reflected a change in estimate during the fourth
quarter (as disclosed in Note (5) to Consolidated Quarterly Information (Unaudited) below), partially
offset by an increase in data usage. In 2008, cost of network usage increased $14.4 million, or 5%, as
voice and data usage on U.S. Cellular’s systems increased driven primarily by continued migration to
voice plans with a larger number of packaged minutes, text messaging plans, and other data offerings.
In both years, data network and developer costs also increased due to the increase in data usage.
U.S. Cellular expects total system operations expenses to increase in the foreseeable future, driven by
the following factors:
• Increases in the number of cell sites and other network facilities within U.S. Cellular’s systems as it
continues to add capacity and enhance quality;
• Continued expansion of 3G services to additional markets; and
• Increases in total customer usage, driven by text messaging and other data usage, both on
U.S. Cellular’s network and by U.S. Cellular’s customers on other carriers’ networks when roaming.
Cost of equipment sold
Cost of equipment sold remained relatively flat in 2009 compared to 2008. A reduction in the average
cost per handset sold, reflecting lower overall purchase costs, was offset by an increase in the total
number of handsets sold. Cost of equipment sold increased in 2008 due primarily to a 13% increase in
the average cost per handset sold as a result of sales of more expensive handsets with expanded
capabilities, including smartphones and premium handsets.
U.S. Cellular expects loss on equipment, defined as equipment sales revenues less cost of equipment
sold, to increase in the foreseeable future as wireless carriers continue to use handset availability and
pricing as a means of competitive differentiation. New handsets with expanded capabilities, particularly
smartphones and premium handsets, generally have higher purchase costs for carriers which, due to
competitive market conditions, generally cannot be recovered through proportionately higher selling
prices to customers.
Selling, general and administrative expenses
Selling, general and administrative expenses include salaries, commissions and expenses of field sales
and retail personnel and facilities; telesales department salaries and expenses; agent commissions and
related expenses; corporate marketing and merchandise management; and advertising. Selling, general
and administrative expenses also include bad debts expense, costs of operating customer care centers
and corporate expenses.
Key components of the net increases in Selling, general and administrative expenses were as follows:
2009—
• General and administrative expenses increased $57.4 million, or 7%, due primarily to higher bad debts
expense as a result of higher bad debt write-offs and a change in estimate during the fourth quarter
(as disclosed in Note (5) to Consolidated Quarterly Information (Unaudited) below); higher employee
related expenses; costs of the Battery Swap program; and investments in multi-year initiatives as
described in the Overview section. Partially offsetting these and other increases were lower USF
9