US Cellular 2009 Annual Report Download - page 40
Download and view the complete annual report
Please find page 40 of the 2009 US Cellular annual report below. You can navigate through the pages in the report by either clicking on the pages listed below, or by using the keyword search tool below to find specific information within the annual report.-
 1
1 -
2
-
3
-
4
-
5
-
6
-
7
-
8
-
9
-
10
-
11
-
12
-
13
-
14
-
15
-
16
-
17
-
18
-
19
-
20
-
21
-
22
-
23
-
24
-
25
-
26
-
27
-
28
-
29
-
 30
30 -
 31
31 -
 32
32 -
 33
33 -
 34
34 -
 35
35 -
 36
36 -
 37
37 -
 38
38 -
 39
39 -
 40
40 -
 41
41 -
 42
42 -
 43
43 -
 44
44 -
 45
45 -
 46
46 -
 47
47 -
 48
48 -
 49
49 -
 50
50 -
51
-
52
-
53
-
54
-
55
-
56
-
57
-
58
-
59
-
60
-
61
-
62
-
63
-
64
-
65
-
66
-
67
-
68
-
69
-
70
-
71
-
72
-
73
-
74
-
75
-
76
-
77
-
78
-
79
-
80
-
81
-
82
-
83
-
84
-
85
-
86
-
87
-
88
-
89
-
90
-
91
-
92
-
93
-
94
-
95
-
96
 |
 |

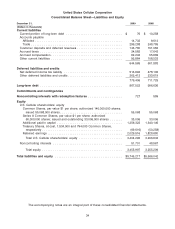
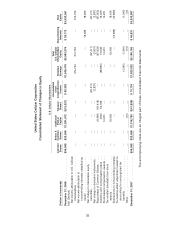
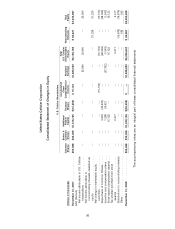
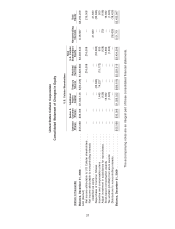
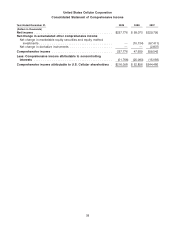
United States Cellular Corporation
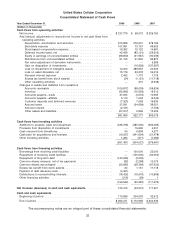
Consolidated Statement of Cash Flows
Year Ended December 31, 2009 2008 2007
(Dollars in thousands)
Cash flows from operating activities
Net income ............................................. $237,776 $ 58,073 $ 329,790
Add (deduct) adjustments to reconcile net income to net cash flows from
operating activities
Depreciation, amortization and accretion ...................... 570,658 576,931 578,186
Bad debts expense .................................... 107,991 73,157 66,923
Stock-based compensation expense ......................... 16,362 15,122 14,681
Deferred income taxes, net ............................... 45,439 (83,121) (26,503)
Equity in earnings of unconsolidated entities ................... (96,800) (91,981) (90,033)
Distributions from unconsolidated entities ..................... 91,105 91,845 86,873
Fair value adjustment of derivative instruments .................. — — 5,388
Gain on disposition of investments .......................... — (16,628) (137,987)
Loss on impairment of intangible assets ...................... 14,000 386,653 24,923
Loss on asset disposals, net .............................. 15,176 23,378 34,016
Noncash interest expense ................................ 2,442 1,772 1,776
Excess tax benefit from stock awards ........................ (24) (1,151) (11,718)
Other operating activities ................................. — 210 (5,538)
Changes in assets and liabilities from operations
Accounts receivable .................................... (109,817) (68,039) (98,634)
Inventory ........................................... (35,992) (15,563) 16,312
Accounts payable—trade ................................ 47,503 (4,572) 10,969
Accounts payable—affiliate ............................... 5,119 1,093 (5,049)
Customer deposits and deferred revenues ..................... (7,323) 7,628 19,935
Accrued taxes ........................................ 37,931 (34,699) 36,051
Accrued interest ...................................... (2,121) — (1,192)
Other assets and liabilities ................................ (57,617) 2,669 13,909
881,808 922,777 863,078
Cash flows from investing activities
Additions to property, plant and equipment ....................... (546,758) (585,590) (565,495)
Proceeds from disposition of investments ........................ — 16,690 4,301
Cash received from divestitures ............................... 50 6,838 4,277
Cash paid for acquisitions and licenses .......................... (16,027) (341,694) (21,478)
Other investing activities .................................... 1,284 (271) (1,086)
(561,451) (904,027) (579,481)
Cash flows from financing activities
Borrowings from revolving credit facilities ........................ — 100,000 25,000
Repayment of revolving credit facilities .......................... — (100,000) (60,000)
Repayment of long-term debt ................................ (140,236) (3,039) —
Common shares reissued, net of tax payments .................... (82) (2,288) 10,073
Common shares repurchased ................................ (33,585) (28,366) (87,902)
Excess tax benefit from stock awards ........................... 24 1,151 11,718
Payment of debt issuance costs ............................... (4,421) — —
Distributions to noncontrolling interests .......................... (18,426) (19,676) (10,866)
Other financing activities .................................... (216) (69) 1
(196,942) (52,287) (111,976)
Net increase (decrease) in cash and cash equivalents ............... 123,415 (33,537) 171,621
Cash and cash equivalents
Beginning of period ....................................... 170,996 204,533 32,912
End of period ........................................... $294,411 $ 170,996 $ 204,533
The accompanying notes are an integral part of these consolidated financial statements.
32