US Cellular 2009 Annual Report Download - page 12
Download and view the complete annual report
Please find page 12 of the 2009 US Cellular annual report below. You can navigate through the pages in the report by either clicking on the pages listed below, or by using the keyword search tool below to find specific information within the annual report.-
 1
1 -
 2
2 -
 3
3 -
 4
4 -
 5
5 -
 6
6 -
 7
7 -
 8
8 -
 9
9 -
 10
10 -
 11
11 -
 12
12 -
 13
13 -
 14
14 -
 15
15 -
 16
16 -
 17
17 -
 18
18 -
 19
19 -
 20
20 -
 21
21 -
 22
22 -
23
-
24
-
25
-
26
-
27
-
28
-
29
-
30
-
31
-
32
-
33
-
34
-
35
-
36
-
37
-
38
-
39
-
40
-
41
-
42
-
43
-
44
-
45
-
46
-
47
-
48
-
49
-
50
-
51
-
52
-
53
-
54
-
55
-
56
-
57
-
58
-
59
-
60
-
61
-
62
-
63
-
64
-
65
-
66
-
67
-
68
-
69
-
70
-
71
-
72
-
73
-
74
-
75
-
76
-
77
-
78
-
79
-
80
-
81
-
82
-
83
-
84
-
85
-
86
-
87
-
88
-
89
-
90
-
91
-
92
-
93
-
94
-
95
-
96
 |
 |

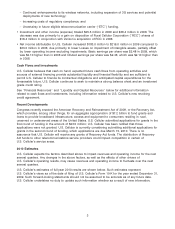
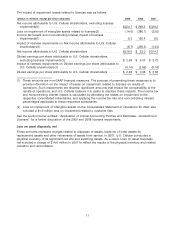
future events or otherwise. There can be no assurance that final results will not differ materially from
such estimated results.
2010 2009
Estimated Results Actual Results
Service revenues .......................... $3,975 - $4,075 million $3,927.9 million
Operating income ......................... $250 - $350 million $ 326.4 million
Depreciation, amortization and accretion expenses,
and losses on disposals and impairment of
assets(1) .............................. Approx. $600 million $ 599.8 million
Capital expenditures ........................ Approx. $600 million $ 546.8 million
(1) 2009 Actual Results include losses on asset disposals of $15.2 million and impairments of
assets of $14.0 million. The 2010 Estimated Results include only the estimate for Depreciation,
amortization and accretion expenses and losses on disposals of assets, and do not include any
estimate for losses on impairment of assets (since these can not be predicted).
U.S. Cellular management believes that the foregoing estimates represent a reasonable view of what is
achievable considering current economic and competitive conditions as well as actions that U.S. Cellular
has taken and will be taking. U.S. Cellular expects to continue its focus on customer satisfaction by
delivering a high quality network, attractively priced service plans, a broad line of handsets and other
products, and outstanding customer service in its company-owned and agent retail stores and customer
care centers. U.S. Cellular believes that future growth in its revenues will result primarily from selling
additional products and services to its existing customers, increasing the number of multi-device users
among its existing customers, and attracting wireless users switching from other wireless carriers, rather
than by adding users that are new to wireless service. U.S. Cellular is focusing on opportunities to
increase revenues, pursuing cost reduction initiatives in various areas and implementing a number of
initiatives to enable future growth. The initiatives are intended, among other things, to allow U.S. Cellular
to accelerate its introduction of new products and services, better segment its customers for new
services and retention, sell additional services such as data, expand its Internet sales and customer
service capabilities, and improve its prepay products and services.
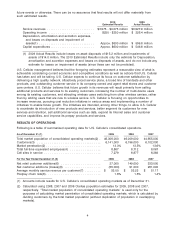
RESULTS OF OPERATIONS
Following is a table of summarized operating data for U.S. Cellular’s consolidated operations.
As of December 31,(1) 2009 2008 2007
Total market population of consolidated operating markets(2) . 46,306,000 46,009,000 44,955,000
Customers(3) ................................... 6,141,000 6,196,000 6,102,000
Market penetration(2) .............................. 13.3% 13.5% 13.6%
Total full-time equivalent employees(4) ................. 8,867 8,712 8,067
Cell sites in service ............................... 7,279 6,877 6,383
For the Year Ended December 31,(5) 2009 2008 2007
Net retail customer additions(6) ...................... 37,000 149,000 333,000
Net customer additions (losses)(6) .................... (55,000) 91,000 281,000
Average monthly service revenue per customer(7) ......... $ 53.00 $ 53.23 $ 51.17
Postpay churn rate(8) .............................. 1.6% 1.5% 1.4%
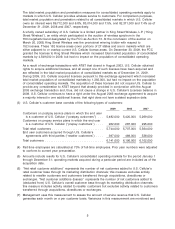
(1) Amounts include results for U.S. Cellular’s consolidated operating markets as of December 31.
(2) Calculated using 2008, 2007 and 2006 Claritas population estimates for 2009, 2008 and 2007,
respectively. ‘‘Total market population of consolidated operating markets’’ is used only for the
purposes of calculating market penetration of consolidated operating markets, which is calculated by
dividing customers by the total market population (without duplication of population in overlapping
markets).
4