US Cellular 2009 Annual Report Download - page 38
Download and view the complete annual report
Please find page 38 of the 2009 US Cellular annual report below. You can navigate through the pages in the report by either clicking on the pages listed below, or by using the keyword search tool below to find specific information within the annual report.-
 1
1 -
2
-
3
-
4
-
5
-
6
-
7
-
8
-
9
-
10
-
11
-
12
-
13
-
14
-
15
-
16
-
17
-
18
-
19
-
20
-
21
-
22
-
23
-
24
-
25
-
26
-
27
-
 28
28 -
 29
29 -
 30
30 -
 31
31 -
 32
32 -
 33
33 -
 34
34 -
 35
35 -
 36
36 -
 37
37 -
 38
38 -
 39
39 -
 40
40 -
 41
41 -
 42
42 -
 43
43 -
 44
44 -
 45
45 -
 46
46 -
 47
47 -
 48
48 -
49
-
50
-
51
-
52
-
53
-
54
-
55
-
56
-
57
-
58
-
59
-
60
-
61
-
62
-
63
-
64
-
65
-
66
-
67
-
68
-
69
-
70
-
71
-
72
-
73
-
74
-
75
-
76
-
77
-
78
-
79
-
80
-
81
-
82
-
83
-
84
-
85
-
86
-
87
-
88
-
89
-
90
-
91
-
92
-
93
-
94
-
95
-
96
 |
 |

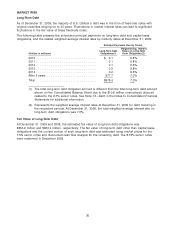
MARKET RISK
Long-Term Debt
As of December 31, 2009, the majority of U.S. Cellular’s debt was in the form of fixed-rate notes with
original maturities ranging up to 30 years. Fluctuations in market interest rates can lead to significant
fluctuations in the fair value of these fixed-rate notes.
The following table presents the scheduled principal payments on long-term debt and capital lease
obligations, and the related weighted average interest rates by maturity dates at December 31, 2009:
Principal Payments Due by Period
Weighted-Avg. Interest
Long-Term Debt Rates on Long-Term
(Dollars in millions) Obligations(1) Debt Obligations(2)
2010 ................................. $ 0.1 9.8%
2011 ................................. 0.1 9.8%
2012 ................................. 0.1 9.8%
2013 ................................. 0.2 9.8%
2014 ................................. 0.2 9.8%
After 5 years ........................... 877.7 7.0%
Total ................................. $878.4 7.0%
(1) The total long-term debt obligation amount is different than the total long-term debt amount
shown on the Consolidated Balance Sheet due to the $10.8 million unamortized discount
related to the 6.7% senior notes. See Note 13—Debt in the Notes to Consolidated Financial
Statements for additional information.
(2) Represents the weighted average interest rates at December 31, 2009 for debt maturing in
the respective periods. At December 31, 2008, the total weighted average interest rate on
long-term debt obligations was 7.3%.
Fair Value of Long-Term Debt
At December 31, 2009 and 2008, the estimated fair value of long-term debt obligations was
$853.9 million and $663.4 million, respectively. The fair value of long-term debt other than capital lease
obligations and the current portion of such long-term debt was estimated using market prices for the
7.5% senior notes and discounted cash flow analysis for the remaining debt. The 8.75% senior notes
were redeemed in December 2009.
30