US Cellular 2009 Annual Report Download - page 22
Download and view the complete annual report
Please find page 22 of the 2009 US Cellular annual report below. You can navigate through the pages in the report by either clicking on the pages listed below, or by using the keyword search tool below to find specific information within the annual report.-
 1
1 -
2
-
3
-
4
-
5
-
6
-
7
-
8
-
9
-
10
-
11
-
 12
12 -
 13
13 -
 14
14 -
 15
15 -
 16
16 -
 17
17 -
 18
18 -
 19
19 -
 20
20 -
 21
21 -
 22
22 -
 23
23 -
 24
24 -
 25
25 -
 26
26 -
 27
27 -
 28
28 -
 29
29 -
 30
30 -
 31
31 -
 32
32 -
33
-
34
-
35
-
36
-
37
-
38
-
39
-
40
-
41
-
42
-
43
-
44
-
45
-
46
-
47
-
48
-
49
-
50
-
51
-
52
-
53
-
54
-
55
-
56
-
57
-
58
-
59
-
60
-
61
-
62
-
63
-
64
-
65
-
66
-
67
-
68
-
69
-
70
-
71
-
72
-
73
-
74
-
75
-
76
-
77
-
78
-
79
-
80
-
81
-
82
-
83
-
84
-
85
-
86
-
87
-
88
-
89
-
90
-
91
-
92
-
93
-
94
-
95
-
96
 |
 |

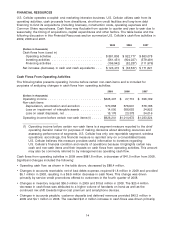
FINANCIAL RESOURCES
U.S. Cellular operates a capital- and marketing-intensive business. U.S. Cellular utilizes cash from its
operating activities, cash proceeds from divestitures, short-term credit facilities and long-term debt
financing to fund its acquisitions (including licenses), construction costs, operating expenses and
Common Share repurchases. Cash flows may fluctuate from quarter to quarter and year to year due to
seasonality, the timing of acquisitions, capital expenditures and other factors. The table below and the
following discussion in this Financial Resources section summarize U.S. Cellular’s cash flow activities in
2009, 2008 and 2007.
2009 2008 2007
(Dollars in thousands)
Cash flows from (used in)
Operating activities ............................ $881,808 $ 922,777 $ 863,078
Investing activities ............................ (561,451) (904,027) (579,481)
Financing activities ............................ (196,942) (52,287) (111,976)
Net increase (decrease) in cash and cash equivalents .... $123,415 $ (33,537) $ 171,621
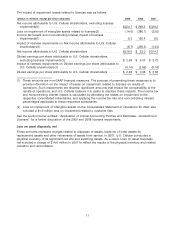
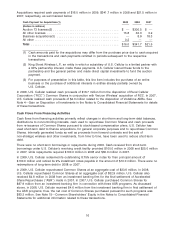
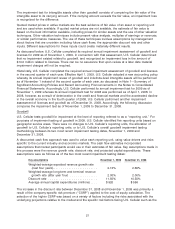
Cash Flows From Operating Activities
The following table presents operating income before certain non-cash items and is included for
purposes of analyzing changes in cash flows from operating activities:
2009 2008 2007
(Dollars in thousands)
Operating income ............................. $326,407 $ 27,710 $ 396,199
Non-cash items
Depreciation, amortization and accretion ........... 570,658 576,931 578,186
Loss on impairment of intangible assets ........... 14,000 386,653 24,923
Loss on asset disposals, net .................... 15,176 23,378 34,016
Operating income before certain non-cash items(1) ..... $926,241 $1,014,672 $1,033,324
(1) Operating income before certain non-cash items is a segment measure reported to the chief
operating decision maker for purposes of making decisions about allocating resources and
assessing performance of segments. U.S. Cellular has only one reportable segment, wireless
operations; accordingly, this financial measure is reported only on a consolidated basis.
U.S. Cellular believes this measure provides useful information to investors regarding
U.S. Cellular’s financial condition and results of operations because it highlights certain key
cash and non-cash items and their impacts on cash flows from operating activities. This amount
may also be commonly referred to by management as operating cash flow.
Cash flows from operating activities in 2009 were $881.8 million, a decrease of $41.0 million from 2008.
Significant changes included the following:
• Operating cash flow, as shown in the table above, decreased by $88.4 million.
• Changes in accounts receivable, net of bad debts expense, required $1.8 million in 2009 and provided
$5.1 million in 2008, resulting in a $6.9 million decrease in cash flows. This change was driven
primarily by service credit promotions offered to customers in the fourth quarter of 2008.
• Changes in inventory required $36.0 million in 2009 and $15.6 million in 2008. The $20.4 million
decrease in cash flows was attributed to a higher volume of handsets on hand as well as the
continued mix shift towards higher-cost premium and smartphone devices.
• Changes in accounts payable, customer deposits and deferred revenues provided $45.3 million in
2009 and $4.1 million in 2008. The resultant $41.2 million increase in cash flows was driven primarily
14