US Cellular 2009 Annual Report Download - page 14
Download and view the complete annual report
Please find page 14 of the 2009 US Cellular annual report below. You can navigate through the pages in the report by either clicking on the pages listed below, or by using the keyword search tool below to find specific information within the annual report.-
 1
1 -
2
-
3
-
 4
4 -
 5
5 -
 6
6 -
 7
7 -
 8
8 -
 9
9 -
 10
10 -
 11
11 -
 12
12 -
 13
13 -
 14
14 -
 15
15 -
 16
16 -
 17
17 -
 18
18 -
 19
19 -
 20
20 -
 21
21 -
 22
22 -
 23
23 -
 24
24 -
25
-
26
-
27
-
28
-
29
-
30
-
31
-
32
-
33
-
34
-
35
-
36
-
37
-
38
-
39
-
40
-
41
-
42
-
43
-
44
-
45
-
46
-
47
-
48
-
49
-
50
-
51
-
52
-
53
-
54
-
55
-
56
-
57
-
58
-
59
-
60
-
61
-
62
-
63
-
64
-
65
-
66
-
67
-
68
-
69
-
70
-
71
-
72
-
73
-
74
-
75
-
76
-
77
-
78
-
79
-
80
-
81
-
82
-
83
-
84
-
85
-
86
-
87
-
88
-
89
-
90
-
91
-
92
-
93
-
94
-
95
-
96
 |
 |

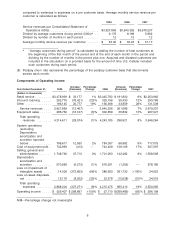
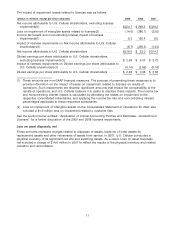
compared to variances in expenses on a per customer basis. Average monthly service revenue per
customer is calculated as follows
2009 2008 2007
Service revenues per Consolidated Statement of
Operations (000s) .......................... $3,927,859 $3,940,326 $3,679,237
Divided by average customers during period (000s)* . . 6,176 6,169 5,992
Divided by number of months in each period ........ 12 12 12
Average monthly service revenue per customer ...... $ 53.00 $ 53.23 $ 51.17
* ‘‘Average customers during period’’ is calculated by adding the number of total customers at
the beginning of the first month of the period and at the end of each month in the period and
dividing by the number of months in the period plus one. Acquired and divested customers are
included in the calculation on a prorated basis for the amount of time U.S. Cellular included
such customers during each period.
(8) Postpay churn rate represents the percentage of the postpay customer base that disconnects
service each month.
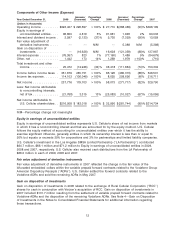
Components of Operating Income
Increase/ Percentage Increase/ Percentage
Year Ended December 31, 2009 (Decrease) Change 2008 (Decrease) Change 2007
(Dollars in thousands)
Retail service ......... $3,478,939 $ 33,177 1% $3,445,762 $ 191,800 6% $3,253,962
Inbound roaming ...... 252,775 (76,421) (23)% 329,196 35,430 12% 293,766
Other .............. 196,145 30,777 19% 165,368 33,859 26% 131,509
Service revenues .... 3,927,859 (12,467) — 3,940,326 261,089 7% 3,679,237
Equipment sales ...... 286,752 (16,107) (5)% 302,859 35,832 13% 267,027
Total operating
revenues ........ 4,214,611 (28,574) (1)% 4,243,185 296,921 8% 3,946,264
System operations
(excluding
Depreciation,
amortization and
accretion reported
below) ............ 796,617 12,560 2% 784,057 66,982 9% 717,075
Cost of equipment sold . 742,993 (413) — 743,406 106,109 17% 637,297
Selling, general and
administrative ....... 1,748,760 47,710 3% 1,701,050 142,482 9% 1,558,568
Depreciation,
amortization and
accretion .......... 570,658 (6,273) (1)% 576,931 (1,255) — 578,186
Loss on impairment of
intangible assets .... 14,000 (372,653) (96)% 386,653 361,730 >100% 24,923
Loss on asset disposals,
net .............. 15,176 (8,202) (35)% 23,378 (10,638) (31)% 34,016
Total operating
expenses ........ 3,888,204 (327,271) (8)% 4,215,475 665,410 19% 3,550,065
Operating income ..... $ 326,407 $ 298,697 >100% $ 27,710 $(368,489) (93)% $ 396,199
N/M—Percentage change not meaningful
6