US Cellular 2009 Annual Report Download - page 30
Download and view the complete annual report
Please find page 30 of the 2009 US Cellular annual report below. You can navigate through the pages in the report by either clicking on the pages listed below, or by using the keyword search tool below to find specific information within the annual report.-
 1
1 -
2
-
3
-
4
-
5
-
6
-
7
-
8
-
9
-
10
-
11
-
12
-
13
-
14
-
15
-
16
-
17
-
18
-
19
-
 20
20 -
 21
21 -
 22
22 -
 23
23 -
 24
24 -
 25
25 -
 26
26 -
 27
27 -
 28
28 -
 29
29 -
 30
30 -
 31
31 -
 32
32 -
 33
33 -
 34
34 -
 35
35 -
 36
36 -
 37
37 -
 38
38 -
 39
39 -
 40
40 -
41
-
42
-
43
-
44
-
45
-
46
-
47
-
48
-
49
-
50
-
51
-
52
-
53
-
54
-
55
-
56
-
57
-
58
-
59
-
60
-
61
-
62
-
63
-
64
-
65
-
66
-
67
-
68
-
69
-
70
-
71
-
72
-
73
-
74
-
75
-
76
-
77
-
78
-
79
-
80
-
81
-
82
-
83
-
84
-
85
-
86
-
87
-
88
-
89
-
90
-
91
-
92
-
93
-
94
-
95
-
96
 |
 |

highly concentrated and competitive nature of the market. U.S. Cellular believes a market participant
would include this CSRP when estimating the discount rate.
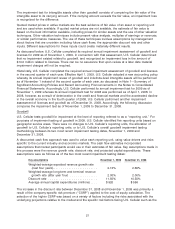
As of November 1, 2009, the fair values of the reporting units exceeded their respective carrying values
by amounts ranging from 41% to 101% of the respective carrying values. Therefore, no impairment of
goodwill existed. Given that the fair values of the respective reporting units significantly exceeded their
respective carrying values, the terminal growth rate assumptions would need to decrease to negative
amounts, ranging from negative 24% to negative 135%, in order to yield estimated fair values equal to
the carrying values of the respective reporting units at November 1, 2009.
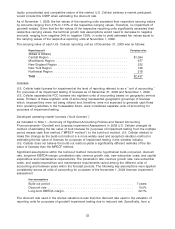
The carrying value of each U.S. Cellular reporting unit as of December 31, 2009 was as follows:
Reporting unit Carrying value
(Dollars in millions)
Central Region .......................................... $1,094
Mid-Atlantic Region ....................................... 677
New England Region ...................................... 222
New York Region ........................................ 126
Northwest Region ........................................ 318
Total ................................................. $2,437
Licenses
U.S. Cellular tests licenses for impairment at the level of reporting referred to as a ‘‘unit of accounting.’’
For purposes of its impairment testing of licenses as of December 31, 2008 and November 1, 2009,
U.S. Cellular separated its FCC licenses into eighteen units of accounting based on geographic service
areas. Thirteen of these eighteen units of accounting represented geographic groupings of licenses
which, because they were not being utilized and, therefore, were not expected to generate cash flows
from operating activities in the foreseeable future, were considered separate units of accounting for
purposes of impairment testing.
Developed operating market licenses (‘‘built licenses’’)
As indicated in Note 1—Summary of Significant Accounting Policies and Recent Accounting
Pronouncements—Goodwill and Licenses Impairment Assessment, in 2009 U.S. Cellular changed its
method of estimating the fair value of built licenses for purposes of impairment testing from the multiple
period excess cash flow method (‘‘MPECF method’’) to the build-out method. U.S. Cellular elected to
make this change as the build-out method is a more widely used and accepted valuation method in
estimating the fair value of licenses for purposes of impairment testing in the wireless industry.
U.S. Cellular does not believe the build-out method yields a significantly different estimate of the fair
value of licenses than the MPECF method.
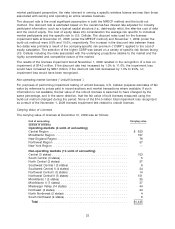
Significant assumptions within the build-out method include the hypothetical build-out period, discount
rate, long-term EBITDA margin, penetration rate, revenue growth rate, new subscriber costs, and capital
expenditure and maintenance requirements. The penetration rate, revenue growth rate, new subscriber
costs, and capital expenditure and maintenance requirements varied among the different units of
accounting and between years within the forecast periods. The following key assumptions were applied
consistently across all units of accounting for purposes of the November 1, 2009 licenses impairment
assessment:
Key assumptions
Build-out period ............................................. 7 years
Discount rate ............................................... 10.0%
Long-term EBITDA margin ...................................... 32.7%
The discount rate used in the license valuation is less than the discount rate used in the valuation of
reporting units for purposes of goodwill impairment testing due to reduced risk. Specifically, from a
22