US Cellular 2009 Annual Report Download - page 2
Download and view the complete annual report
Please find page 2 of the 2009 US Cellular annual report below. You can navigate through the pages in the report by either clicking on the pages listed below, or by using the keyword search tool below to find specific information within the annual report.-
 1
1 -
 2
2 -
 3
3 -
 4
4 -
 5
5 -
 6
6 -
 7
7 -
 8
8 -
 9
9 -
 10
10 -
 11
11 -
 12
12 -
 13
13 -
14
-
15
-
16
-
17
-
18
-
19
-
20
-
21
-
22
-
23
-
24
-
25
-
26
-
27
-
28
-
29
-
30
-
31
-
32
-
33
-
34
-
35
-
36
-
37
-
38
-
39
-
40
-
41
-
42
-
43
-
44
-
45
-
46
-
47
-
48
-
49
-
50
-
51
-
52
-
53
-
54
-
55
-
56
-
57
-
58
-
59
-
60
-
61
-
62
-
63
-
64
-
65
-
66
-
67
-
68
-
69
-
70
-
71
-
72
-
73
-
74
-
75
-
76
-
77
-
78
-
79
-
80
-
81
-
82
-
83
-
84
-
85
-
86
-
87
-
88
-
89
-
90
-
91
-
92
-
93
-
94
-
95
-
96
 |
 |
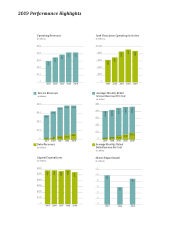
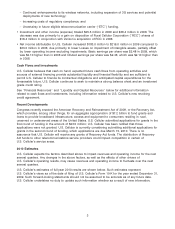
2009 Performance Highlights
0
$1.0
$2.0
$3.0
$4.0
$5.0
Operating Revenues
(in billions)
$3.0
2005
$3.9
2007
$4.2
2008
$4.2
20092006
$3.5
0
$200
$400
$600
$800
$1,000
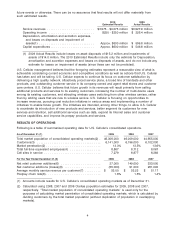
Cash Flows from Operating Activities
(in millions)
2005
$630
$701
2006 2007
$863
2008
$923
2009
$882
.4
.6
.8
1.2
0
.2
1.0
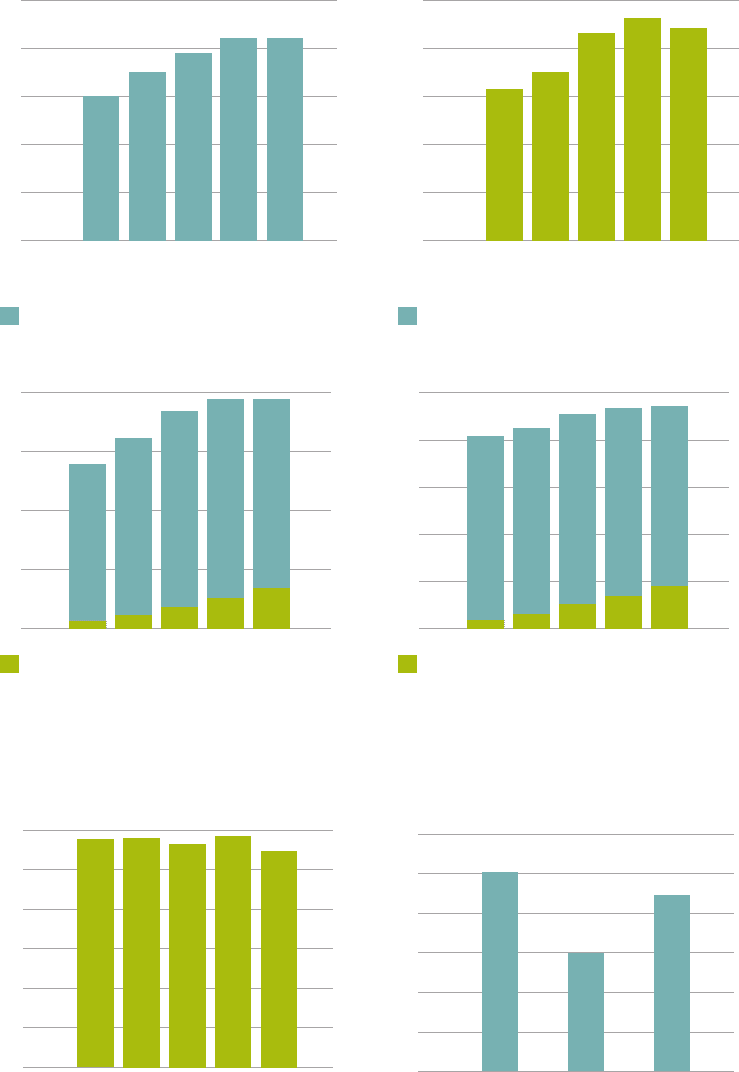
Shares Repurchased
(in millions)
2007
1.01
2008
.60
2009
.89
Capital Expenditures
(in millions)
0
$200
$100
$300
$400
$500
$600
2005 2006 2007 2008 2009
$577
$580
$565
$586
$547
0
$10
$20
$30
$40
$50
2005 2006 2007 2008 2009
Average Monthly Retail
Service Revenue Per Unit
(in dollars)
Average Monthly Retail
Data Revenue Per Unit
(in dollars)
$2.10 $3.19 $5.12 $6.91 $9.22
$40.60
$42.35
$45.25
$46.55
$46.94
0
$1.0
$2.0
$3.0
$4.0
2005 2006 2007 2008 2009
Service Revenues
(in billions)
Data Revenues
(in millions)
$2.8
$131
$3.2
$217
$3.7
$368
$3.9
$512
$3.9
$683