U-Haul 2007 Annual Report Download - page 72
Download and view the complete annual report
Please find page 72 of the 2007 U-Haul annual report below. You can navigate through the pages in the report by either clicking on the pages listed below, or by using the keyword search tool below to find specific information within the annual report.-
 1
1 -
2
-
3
-
4
-
5
-
6
-
7
-
8
-
9
-
10
-
11
-
12
-
13
-
14
-
15
-
16
-
17
-
18
-
19
-
20
-
21
-
22
-
23
-
24
-
25
-
26
-
27
-
28
-
29
-
30
-
31
-
32
-
33
-
34
-
35
-
36
-
37
-
38
-
39
-
40
-
41
-
42
-
43
-
44
-
45
-
46
-
47
-
48
-
49
-
50
-
51
-
52
-
53
-
54
-
55
-
56
-
57
-
58
-
59
-
60
-
61
-
 62
62 -
 63
63 -
 64
64 -
 65
65 -
 66
66 -
 67
67 -
 68
68 -
 69
69 -
 70
70 -
 71
71 -
 72
72 -
 73
73 -
 74
74 -
 75
75 -
 76
76 -
 77
77 -
 78
78 -
 79
79 -
 80
80 -
 81
81 -
 82
82 -
83
-
84
-
85
-
86
-
87
-
88
-
89
-
90
-
91
-
92
-
93
-
94
-
95
-
96
-
97
-
98
-
99
-
100
-
101
-
102
-
103
-
104
-
105
-
106
-
107
-
108
-
109
-
110
-
111
-
112
-
113
-
114
-
115
-
116
-
117
-
118
-
119
-
120
-
121
-
122
-
123
-
124
-
125
-
126
-
127
-
128
-
129
-
130
-
131
-
132
-
133
-
134
-
135
-
136
-
137
-
138
-
139
-
140
-
141
-
142
-
143
-
144
-
145
-
146
 |
 |

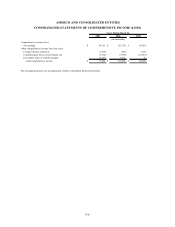
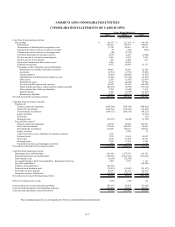
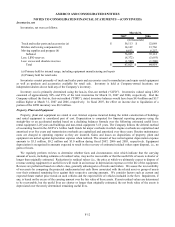
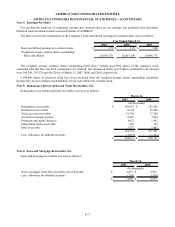
AMERCO AND CONSOLIDATED ENTITIES
CONSOLIDATED STATEMENTS OF CASH FLOWS
2007 2006 2005
Cash flows from o
p
eratin
g
activities:
Net earnin
g
s$ 90,553 $ 121,154 $ 89,424
De
p
reciation 186,106 133,572 118,091
Amortization of deferred
p
olic
y
ac
q
uisition costs 17,138 24,261 28,512
Chan
g
e in
p
rovision for losses on trade receivables 49
(
183
)
(
506
)
Chan
g
e in
p
rovision for losses on mort
g
a
g
e notes
(
40
)
(
2,230
)
-
Provision
(
reduction
)
for inventor
y
reserves 2,679 2,458
(
1,000
)
Net loss on sale of real and
p
ersonal
p
ro
p
ert
y
3,483 9,245 3,012
Net loss on sale of investments 622 2,408 616
Write-off of unamortized debt issuance costs 6,969 13,629 -
Deferred income taxes 6,972 28,429 61,113
Net chan
g
e in other o
p
eratin
g
assets and liabilities:
Reinsurance recoverables and trade receivables 48,907 10,661 32,189
Inventories
(
4,761
)
(
3,596
)
(
9,856
)
Pre
p
aid ex
p
enses
(
8,205
)
(
28,809
)
(
6,702
)
Ca
p
italization of deferred
p
olic
y
ac
q
uistion costs
(
8,168
)
(
12,110
)
(
8,873
)
Other assets 2,929
(
1,457
)
(
23,887
)
Related
p
art
y
assets 8,616
(
8,090
)
74,780
Accounts
p
a
y
able and accrued ex
p
enses 22,658 36,596
(
96,022
)
Polic
y
benefits and losses, claims and loss ex
p
enses
p
a
y
able
(
40,169
)
(
4,918
)
(
15,618
)
Other
p
olic
y
holders' funds and liabilities 2,709
(
3,908
)
7,910
Deferred income 1,266
(
2,588
)
(
14,407
)
Related
p
art
y
liabilities 10,408
(
44,016
)
(
18,079
)
Net cash
p
rovided b
y
o
p
eratin
g
activities 350,721 270,508 220,697
Cash flow from investment activities:
Purchase of:
Pro
p
ert
y
,
p
lant and e
q
ui
p
ment
(
648,344
)
(
344,382
)
(
284,966
)
Short term investments
(
249,392
)
(
534,106
)
(
16,830
)
Fixed maturit
y
investments
(
109,672
)
(
260,138
)
(
98,211
)
E
q
uit
y
securities - -
(
6,349
)
Real estate - -
(
63
)
Mort
g
a
g
e loans
(
10,725
)
(
8,868
)
(
2,750
)
Proceeds from sales of:
Pro
p
ert
y
,
p
lant and e
q
ui
p
ment 89,672 59,960 243,707
Short term investments 276,690 600,850 10,866
Fixed maturit
y
investments 116,858 159,616 152,024
E
q
uit
y
securities - 6,769 56
Cash received in excess of
p
urchase of com
p
an
y
ac
q
uired 1,235 - -
Preferred stock 1,225 11,650 15,803
Real estate 6,870 36,388 16,185
Mort
g
a
g
e loans 7,062 11,762 5,368
Pa
y
ments from notes and mort
g
a
g
e receivables 902 1,663 1,336
Net cash
p
rovided
(
used
)
b
y
investin
g
activities
(
517,619
)
(
258,836
)
36,176
Cash flow from financin
g
activities:
Borrowin
g
s from credit facilities 410,189 1,277,047 129,355
Princi
p
al re
p
a
y
ments on credit facilties
(
196,072
)
(
1,093,342
)
(
213,405
)
Debt issuance costs
(
3,058
)
(
29,588
)
-
Levera
g
ed Em
p
lo
y
ee Stock Ownershi
p
Plan - Re
p
a
y
ment from loan 1,204 1,553 1,135
Pa
y
off of ca
p
ital leases - -
(
99,609
)
Treasur
y
stock re
p
urchases
(
49,106
)
- -
Preferred stock dividends
p
aid
(
12,963
)
(
12,963
)
(
29,167
)
Investment contract de
p
osits 16,695 20,322 26,331
Investment contract withdrawals
(
79,204
)
(
75,011
)
(
97,137
)
Net cash
p
rovided
(
used
)
b
y
financin
g
activities 87,685 88,018
(
282,497
)
Effects of exchan
g
e rate on cash
(
974
)
(
186
)
22
Increase
(
decrease
)
in cash and cash e
q
uivalents
(
80,187
)
99,504
(
25,602
)
Cash and cash e
q
uivalents at the be
g
innin
g
of
p
eriod 155,459 55,955 81,557
Cash and cash equivalents at the end of period $ 75,272 $ 155,459 $ 55,955
(In thousands)
Years Ended March 31,
The accompanying notes are an integral part of these consolidated financial statements.
F-7