U-Haul 2007 Annual Report Download - page 44
Download and view the complete annual report
Please find page 44 of the 2007 U-Haul annual report below. You can navigate through the pages in the report by either clicking on the pages listed below, or by using the keyword search tool below to find specific information within the annual report.-
 1
1 -
2
-
3
-
4
-
5
-
6
-
7
-
8
-
9
-
10
-
11
-
12
-
13
-
14
-
15
-
16
-
17
-
18
-
19
-
20
-
21
-
22
-
23
-
24
-
25
-
26
-
27
-
28
-
29
-
30
-
31
-
32
-
33
-
 34
34 -
 35
35 -
 36
36 -
 37
37 -
 38
38 -
 39
39 -
 40
40 -
 41
41 -
 42
42 -
 43
43 -
 44
44 -
 45
45 -
 46
46 -
 47
47 -
 48
48 -
 49
49 -
 50
50 -
 51
51 -
 52
52 -
 53
53 -
 54
54 -
55
-
56
-
57
-
58
-
59
-
60
-
61
-
62
-
63
-
64
-
65
-
66
-
67
-
68
-
69
-
70
-
71
-
72
-
73
-
74
-
75
-
76
-
77
-
78
-
79
-
80
-
81
-
82
-
83
-
84
-
85
-
86
-
87
-
88
-
89
-
90
-
91
-
92
-
93
-
94
-
95
-
96
-
97
-
98
-
99
-
100
-
101
-
102
-
103
-
104
-
105
-
106
-
107
-
108
-
109
-
110
-
111
-
112
-
113
-
114
-
115
-
116
-
117
-
118
-
119
-
120
-
121
-
122
-
123
-
124
-
125
-
126
-
127
-
128
-
129
-
130
-
131
-
132
-
133
-
134
-
135
-
136
-
137
-
138
-
139
-
140
-
141
-
142
-
143
-
144
-
145
-
146
 |
 |

38
L
no assurance that future cash flows will
b
ents, other investments, fixed maturities, and related party assets) and obligations of
(b) Payable to third parties
iquidity and Capital Resources
We believe our current capital structure will allow us to achieve our operational plans and goals, and provide us
with sufficient liquidity for the next three to five years. The majority of the obligations currently in place mature at
the end of fiscal years 2015 or 2018. As a result, we believe that our liquidity is sufficient. We believe these
improvements will enhance our access to capital markets. However, there is
e sufficient to meet our outstanding obligations or our future capital needs.
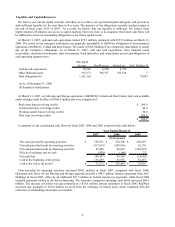
At March 31, 2007, cash and cash equivalents totaled $75.3 million, compared with $155.5 million on March 31,
2006. The assets of our insurance subsidiaries are generally unavailable to fulfill the obligations of non-insurance
operations (AMERCO, U-Haul and Real Estate). The assets of SAC Holding II are completely unavailable to satisfy
any of the Company’ s obligations. As of March 31, 2007, cash and cash equivalents, other financial assets
(receivables, short-term investm
each operating segment were:
Moving &
Storage RepWest (a) Oxford (a) SAC Holding II
Cash & cash equivalents 64,306 4,228 6,738 -
Other financial assets 363,373 396,337 633,526 5
Debt obligations (b) 1,181,165 - - 74,887
(a) As of December 31, 2006
-Haul and Real Estate) had cash available
u
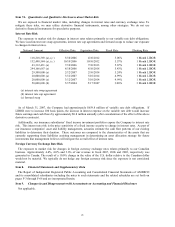
At March 31, 2007, our Moving and Storage operations (AMERCO, U
nder existing credit facilities of $360.0 million and were comprised of:
Real estate loan (revolving credit) $ 200.0
Construction loan (revolving credit) 40.0
Working capital loan (revolving credit) 20.0
Fleet loan (revolving credit) 100.0
$360.0
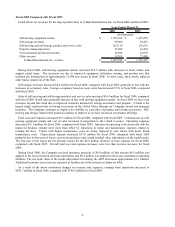
A summary of our consolidated cash flows for fiscal 2007, 2006 and 2005 is shown in the table below:
2007 2006 2005
Net cash provided by operating activities $ 350,721 $ 270,508 $ 220,697
Net cash provided (used) by investing activities (517,619) (258,836) 36,176
Net cash provided (used) by financing activities 87,685 88,018 (282,497)
Effects of exchange rate on cash (974) (186) 22
Net cash flow (80,187) 99,504 (25,602)
Cash at the beginning of the period 155,459 55,955 81,557
Cash at the end of the period $ 75,272 $ 155,459 $ 55,955
Year Ended March 31,
(In thousands)
Cash provided by operating activities increased $80.2 million in fiscal 2007, compared with fiscal 2006.
Operating cash flows for the Moving and Storage segment included a $44.5 million interest repayment from SAC
Holdings in fiscal 2007, offset by an additional $31.5 million in federal income tax payments, while fiscal 2006
included payments related to the debt refinancing. The insurance companies operating cash flows increased $46.4
million. The increase at Oxford was due primarily to a $10.6 million lawsuit settlement in fiscal 2006. RepWest
increased due primarily to $14.0 million received from the exchange of related party assets combined with the
collection of outstanding reinsurance recoverable.