U-Haul 2007 Annual Report Download - page 69
Download and view the complete annual report
Please find page 69 of the 2007 U-Haul annual report below. You can navigate through the pages in the report by either clicking on the pages listed below, or by using the keyword search tool below to find specific information within the annual report.-
 1
1 -
2
-
3
-
4
-
5
-
6
-
7
-
8
-
9
-
10
-
11
-
12
-
13
-
14
-
15
-
16
-
17
-
18
-
19
-
20
-
21
-
22
-
23
-
24
-
25
-
26
-
27
-
28
-
29
-
30
-
31
-
32
-
33
-
34
-
35
-
36
-
37
-
38
-
39
-
40
-
41
-
42
-
43
-
44
-
45
-
46
-
47
-
48
-
49
-
50
-
51
-
52
-
53
-
54
-
55
-
56
-
57
-
58
-
 59
59 -
 60
60 -
 61
61 -
 62
62 -
 63
63 -
 64
64 -
 65
65 -
 66
66 -
 67
67 -
 68
68 -
 69
69 -
 70
70 -
 71
71 -
 72
72 -
 73
73 -
 74
74 -
 75
75 -
 76
76 -
 77
77 -
 78
78 -
 79
79 -
80
-
81
-
82
-
83
-
84
-
85
-
86
-
87
-
88
-
89
-
90
-
91
-
92
-
93
-
94
-
95
-
96
-
97
-
98
-
99
-
100
-
101
-
102
-
103
-
104
-
105
-
106
-
107
-
108
-
109
-
110
-
111
-
112
-
113
-
114
-
115
-
116
-
117
-
118
-
119
-
120
-
121
-
122
-
123
-
124
-
125
-
126
-
127
-
128
-
129
-
130
-
131
-
132
-
133
-
134
-
135
-
136
-
137
-
138
-
139
-
140
-
141
-
142
-
143
-
144
-
145
-
146
 |
 |

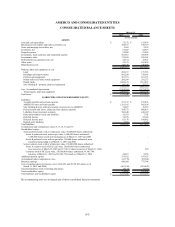
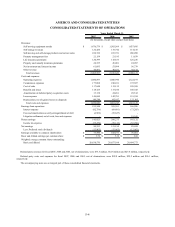
AMERCO AND CONSOLIDATED ENTITIES
CONSOLIDATED STATEMENTS OF OPERATIONS
2007 2006 2005
Revenues:
Self-moving equipment rentals $ 1,476,579 $ 1,503,569 $ 1,437,895
Self-storage revenues 126,424 119,742 114,155
Self-moving and self-storage products and service sales 224,722 223,721 206,098
Property management fees 21,154 21,195 11,839
Life insurance premiums 120,399 118,833 126,236
Property and casualty insurance premiums 24,335 26,001 24,987
Net investment and interest income 61,093 53,094 56,739
Other revenue 30,891 40,471 30,172
Total revenues 2,085,597 2,106,626 2,008,121
Costs and expenses:
Operating expenses 1,080,897 1,080,990 1,122,197
Commission expenses 177,008 180,101 172,307
Cost of sales 117,648 113,135 105,309
Benefits and losses 118,725 117,160 140,343
Amortization of deferred policy acquisition costs 17,138 24,261 28,512
Lease expense 149,044 142,781 151,354
Depreciation, net of (gains) losses on disposals 189,589 142,817 121,103
Total costs and expenses 1,850,049 1,801,245 1,841,125
Earnings from operations 235,548 305,381 166,996
Interest expense (82,756) (69,481) (73,205)
Fees and amortization on early extinguishment of debt (6,969) (35,627) -
Litigation settlement, net of costs, fees and expenses - - 51,341
Pretax earnings 145,823 200,273 145,132
Income tax expense (55,270) (79,119) (55,708)
Net earnings 90,553 121,154 89,424
Less: Preferred stock dividends (12,963) (12,963) (12,963)
Earnings available to common shareholders $ 77,590 $ 108,191 $ 76,461
Basic and diluted earnings per common share $ 3.72 $ 5.19 $ 3.68
Weighted average common shares outstanding:
Basic and diluted 20,838,570 20,857,108 20,804,773
Years Ended March 31,
(In thousands, except share and per share data)
Related party revenues for fiscal 2007, 2006 and 2005, net of eliminations, were $33.5 million, $32.6 million and $25.8 million, respectively.
Related party costs and expenses for fiscal 2007, 2006 and 2005, net of eliminations, were $28.0 million, $29.2 million and $26.1 million,
respectively.
The accompanying notes are an integral part of these consolidated financial statements.
F-4