U-Haul 2007 Annual Report Download - page 117
Download and view the complete annual report
Please find page 117 of the 2007 U-Haul annual report below. You can navigate through the pages in the report by either clicking on the pages listed below, or by using the keyword search tool below to find specific information within the annual report.-
 1
1 -
2
-
3
-
4
-
5
-
6
-
7
-
8
-
9
-
10
-
11
-
12
-
13
-
14
-
15
-
16
-
17
-
18
-
19
-
20
-
21
-
22
-
23
-
24
-
25
-
26
-
27
-
28
-
29
-
30
-
31
-
32
-
33
-
34
-
35
-
36
-
37
-
38
-
39
-
40
-
41
-
42
-
43
-
44
-
45
-
46
-
47
-
48
-
49
-
50
-
51
-
52
-
53
-
54
-
55
-
56
-
57
-
58
-
59
-
60
-
61
-
62
-
63
-
64
-
65
-
66
-
67
-
68
-
69
-
70
-
71
-
72
-
73
-
74
-
75
-
76
-
77
-
78
-
79
-
80
-
81
-
82
-
83
-
84
-
85
-
86
-
87
-
88
-
89
-
90
-
91
-
92
-
93
-
94
-
95
-
96
-
97
-
98
-
99
-
100
-
101
-
102
-
103
-
104
-
105
-
106
-
 107
107 -
 108
108 -
 109
109 -
 110
110 -
 111
111 -
 112
112 -
 113
113 -
 114
114 -
 115
115 -
 116
116 -
 117
117 -
 118
118 -
 119
119 -
 120
120 -
 121
121 -
 122
122 -
 123
123 -
 124
124 -
 125
125 -
 126
126 -
 127
127 -
128
-
129
-
130
-
131
-
132
-
133
-
134
-
135
-
136
-
137
-
138
-
139
-
140
-
141
-
142
-
143
-
144
-
145
-
146
 |
 |

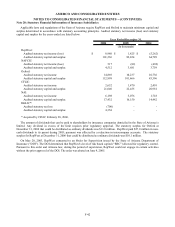
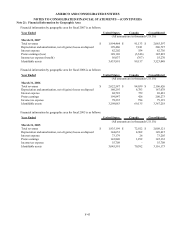
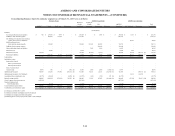
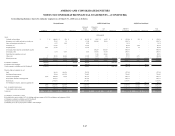
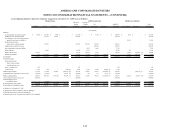
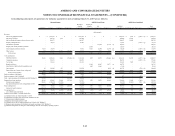
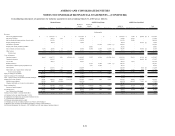
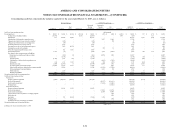
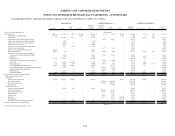
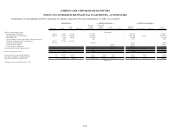
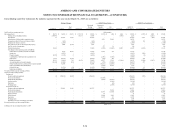
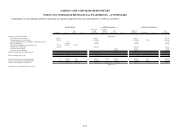
AMERCO AND CONSOLIDATED ENTITIES
NOTES TO CONSOLIDATED FINANCIAL STATEMENTS -- (CONTINUED)
F-52
Consolidating cash flow statements by industry segment for the year ended March 31, 2007, are as follows:
AMERCO U-Haul
Real
Estate Elimination
Moving &
Storage
Consolidated
Property &
Casualty
Insurance (a)
Life
Insurance (a) Elimination
AMERCO
Consolidated SAC Holding II Elimination
Total
Consolidated
90,205$ 30,104$ (4,338)$ (25,766)$ 90,205$ (155)$ 9,658$ (9,503)$ 90,205$ 527$ (179)$ 90,553$
(35,796) - - 25,766 (10,030) - - 9,503 (527) - 527 -
293 172,698 10,984 - 183,975 - - - 183,975 2,691 (560) 186,106
- - - - - 2,057 15,081 - 17,138 - - 17,138
- (145) - - (145) - 194 - 49 - - 49
(40) - (40) - - - (40) - - (40)
- 2,679 - - 2,679 - - - 2,679 - - 2,679
- 7,862 (4,379) - 3,483 - - - 3,483 - - 3,483
- - - - - 559 63 - 622 - - 622
- 302 6,667 - 6,969 - - - 6,969 - - 6,969
5,239 (19) - - 5,220 5,292 (4,456) - 6,056 704 212 6,972
- (859) (2) - (861) 44,736 5,032 - 48,907 - - 48,907
- (4,718) - - (4,718) - - - (4,718) (43) - (4,761)
(9,122) 1,193 (30) - (7,959) - - - (7,959) (246) - (8,205)
- - - - - (1,093) (7,075) - (8,168) - - (8,168)
(10) 1,111 2,182 - 3,283 284 (395) - 3,172 (243) - 2,929
(1,479) (12,973) 8 - (14,444) 14,384 5,781 - 5,721 2,895 - 8,616
(19,561) 33,125 4,312 - 17,876 - 4,451 - 22,327 331 - 22,658
- 35,298 - - 35,298 (61,719) (13,748) - (40,169) - - (40,169)
- - - - - 2,411 298 - 2,709 - - 2,709
- 1,215 - - 1,215 - - - 1,215 51 - 1,266
(201) 19,878 - - 19,677 (1,317) (3,507) - 14,853 (4,445) - 10,408
29,568 286,711 15,404 - 331,683 5,439 11,377 - 348,499 2,222 - 350,721
(1,998) (586,737) (58,477) - (647,212) - - - (647,212) (1,132) - (648,344)
- - - - - (83,277) (166,115) - (249,392) - - (249,392)
- - - - - (71,630) (38,042) - (109,672) - - (109,672)
- - - - - - (10,725) - (10,725) - - (10,725)
- 85,134 4,538 - 89,672 - - - 89,672 - - 89,672
- - - - - 111,936 164,754 - 276,690 - - 276,690
- - - - - 22,409 94,449 - 116,858 - - 116,858
- - - - - - 1,235 - 1,235 - - 1,235
- - - - - - 1,225 - 1,225 - - 1,225
- 195 (2,861) - (2,666) 9,536 - - 6,870 - - 6,870
- - - - - - 7,062 - 7,062 - - 7,062
- 136 766 - 902 - - - 902 - - 902
(1,998) (501,272) (56,034) - (559,304) (11,026) 53,843 - (516,487) (1,132) - (517,619)
Payments from notes and mortgage receivables
Net cash provided (used) by investing activities
(a) Balance for the year ended December 31, 2006
Preferred stock
Proceeds from sales of:
Real estate
Mortgage loans
Property, plant and equipment
Related party liabilities
Net cash provided (used) by operating activities
Fixed maturity investments
Cash received in excess of purchase of company acquired
Cash flows from investing activities:
Fixed maturity investments
Mortgage loans
Purchases of:
Property, plant and equipment
Accounts payable and accrued expenses
Policy benefits and losses, claims and loss expenses payable
Other policyholders' funds and liabilities
Deferred income
Prepaid expenses
Capitalization of deferred policy acquisition costs
Other assets
Related party assets
AMERCO Legal Group AMERCO as ConsolidatedMoving & Storage
(In thousands)
(page 1 of 2)
Cash flows from operating activities:
Net earnings (loss)
Earnings from consolidated entities
Depreciation
Amortization of deferred policy acquisition costs
Changes in provision for losses on trade receivables
Provision (reduction) for inventory reserves
Changes in provision for losses on mortgage notes
Write-off of unamortized debt issuance costs
Short term investments
Short term investments
Net (gain) loss on sale of real and personal property
Net (gain) loss on sale of investments
Deferred income taxes
Net change in other operating assets and liabilities:
Reinsurance recoverables and trade receivables
Inventories