U-Haul 2007 Annual Report Download - page 108
Download and view the complete annual report
Please find page 108 of the 2007 U-Haul annual report below. You can navigate through the pages in the report by either clicking on the pages listed below, or by using the keyword search tool below to find specific information within the annual report.-
 1
1 -
2
-
3
-
4
-
5
-
6
-
7
-
8
-
9
-
10
-
11
-
12
-
13
-
14
-
15
-
16
-
17
-
18
-
19
-
20
-
21
-
22
-
23
-
24
-
25
-
26
-
27
-
28
-
29
-
30
-
31
-
32
-
33
-
34
-
35
-
36
-
37
-
38
-
39
-
40
-
41
-
42
-
43
-
44
-
45
-
46
-
47
-
48
-
49
-
50
-
51
-
52
-
53
-
54
-
55
-
56
-
57
-
58
-
59
-
60
-
61
-
62
-
63
-
64
-
65
-
66
-
67
-
68
-
69
-
70
-
71
-
72
-
73
-
74
-
75
-
76
-
77
-
78
-
79
-
80
-
81
-
82
-
83
-
84
-
85
-
86
-
87
-
88
-
89
-
90
-
91
-
92
-
93
-
94
-
95
-
96
-
97
-
 98
98 -
 99
99 -
 100
100 -
 101
101 -
 102
102 -
 103
103 -
 104
104 -
 105
105 -
 106
106 -
 107
107 -
 108
108 -
 109
109 -
 110
110 -
 111
111 -
 112
112 -
 113
113 -
 114
114 -
 115
115 -
 116
116 -
 117
117 -
 118
118 -
119
-
120
-
121
-
122
-
123
-
124
-
125
-
126
-
127
-
128
-
129
-
130
-
131
-
132
-
133
-
134
-
135
-
136
-
137
-
138
-
139
-
140
-
141
-
142
-
143
-
144
-
145
-
146
 |
 |

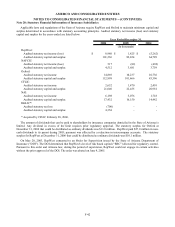
AMERCO AND CONSOLIDATED ENTITIES
NOTES TO CONSOLIDATED FINANCIAL STATEMENTS -- (CONTINUED)
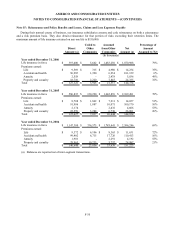
Note 21: Financial Information by Geographic Area
Financial information by geographic area for fiscal 2007 is as follows:
Year Ended United States Canada Consolidated
March 31, 2007
Total revenues $ 1,994,464 $ 91,133 $ 2,085,597
Depreciation and amortization, net of (gains) losses on disposal 199,486 7,241 206,727
Interest expense 82,202 554 82,756
Pretax earnings (loss) 149,169 (3,346) 145,823
Income tax expense (benefit) 56,037 (767) 55,270
Identifiable assets 3,433,891 89,157 3,523,048
(All amounts are in thousands U.S. $'s)
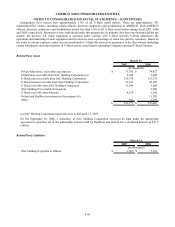
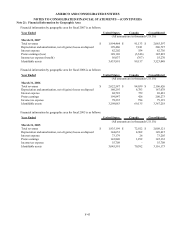
Financial information by geographic area for fiscal 2006 is as follows:
Year Ended United States Canada Consolidated
March 31, 2006
Total revenues $ 2,022,587 $ 84,039 $ 2,106,626
Depreciation and amortization, net of (gains) losses on disposal 160,295 6,783 167,078
Interest expense 68,722 759 69,481
Pretax earnings 199,847 426 200,273
Income tax expense 78,335 784 79,119
Identifiable assets 3,298,083 69,135 3,367,218
(All amounts are in thousands U.S. $'s)
Financial information by geographic area for fiscal 2005 is as follows:
Year Ended United States Canada Consolidated
March 31, 2005
Total revenues $ 1,935,199 $ 72,922 $ 2,008,121
Depreciation and amortization, net of (gains) losses on disposal 144,653 4,962 149,615
Interest expense 73,179 26 73,205
Pretax earnings 143,840 1,292 145,132
Income tax expense 55,708 - 55,708
Identifiable assets 3,045,591 70,582 3,116,173
(All amounts are in thousands U.S. $'s)
F-43