U-Haul 2007 Annual Report Download - page 128
Download and view the complete annual report
Please find page 128 of the 2007 U-Haul annual report below. You can navigate through the pages in the report by either clicking on the pages listed below, or by using the keyword search tool below to find specific information within the annual report.-
 1
1 -
2
-
3
-
4
-
5
-
6
-
7
-
8
-
9
-
10
-
11
-
12
-
13
-
14
-
15
-
16
-
17
-
18
-
19
-
20
-
21
-
22
-
23
-
24
-
25
-
26
-
27
-
28
-
29
-
30
-
31
-
32
-
33
-
34
-
35
-
36
-
37
-
38
-
39
-
40
-
41
-
42
-
43
-
44
-
45
-
46
-
47
-
48
-
49
-
50
-
51
-
52
-
53
-
54
-
55
-
56
-
57
-
58
-
59
-
60
-
61
-
62
-
63
-
64
-
65
-
66
-
67
-
68
-
69
-
70
-
71
-
72
-
73
-
74
-
75
-
76
-
77
-
78
-
79
-
80
-
81
-
82
-
83
-
84
-
85
-
86
-
87
-
88
-
89
-
90
-
91
-
92
-
93
-
94
-
95
-
96
-
97
-
98
-
99
-
100
-
101
-
102
-
103
-
104
-
105
-
106
-
107
-
108
-
109
-
110
-
111
-
112
-
113
-
114
-
115
-
116
-
117
-
 118
118 -
 119
119 -
 120
120 -
 121
121 -
 122
122 -
 123
123 -
 124
124 -
 125
125 -
 126
126 -
 127
127 -
 128
128 -
 129
129 -
 130
130 -
 131
131 -
 132
132 -
 133
133 -
 134
134 -
 135
135 -
 136
136 -
 137
137 -
 138
138 -
139
-
140
-
141
-
142
-
143
-
144
-
145
-
146
 |
 |

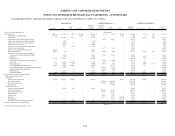
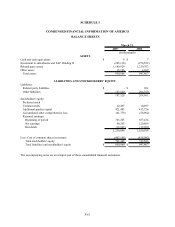
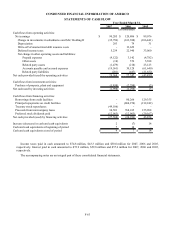
CONDENSED FINANCIAL INFORMATION OF AMERCO
STATEMENTS OF CASH FLOW
2007 2006 2005
Cash flows from operating activities:
Net earnings $ 90,205 $ 120,806 $ 89,076
Change in investments in subsidiaries and SAC Holding II (35,796) (163,388) (106,441)
Depreciation 293 79 31
Write-off of unamortized debt issuance costs - 13,629 -
Deferred income taxes 5,239 22,940 33,060
Net change in other operating assets and liabilities:
Prepaid expenses (9,122) 3,142 (4,782)
Other assets (10) 576 5,388
Related party assets (1,479) (218) 23,123
Accounts payable and accrued expenses (19,561) 30,128 (61,640)
Related party liabilities (201) (447) (21,652)
Net cash provided (used) by operating activities 29,568 27,247 (43,837)
Cash flows from investment activities:
Purchase of property, plant and equipment (1,998) (2,298) (3)
Net cash used by investing activities (1,998) (2,298) (3)
Cash flows from financing activities:
Borrowings from credit facilities - 80,266 129,355
Principal repayments on credit facilities - (860,274) (212,242)
Treasury stock repurchases (49,106) - -
Proceeds from intercompany loans 34,501 768,015 155,908
Preferred stock dividends paid (12,963) (12,963) (29,167)
Net cash provided (used) by financing activities (27,568) (24,956) 43,854
Increase (decrease) in cash and cash equivalents 2 (7) 14
Cash and cash equivalents at beginning of period 7 14 -
Cash and cash equivalents at end of period
$
9 $ 7 $ 14
Year Ended March 31,
(In thousands)
Income taxes paid in cash amounted to $74.8 million, $43.3 million and $30.0 million for 2007, 2006 and 2005,
respectively. Interest paid in cash amounted to $72.9 million, $59.8 million and $57.6 million for 2007, 2006 and 2005,
respectively.
The accompanying notes are an integral part of these consolidated financial statements.
F-63