U-Haul 2007 Annual Report Download - page 35
Download and view the complete annual report
Please find page 35 of the 2007 U-Haul annual report below. You can navigate through the pages in the report by either clicking on the pages listed below, or by using the keyword search tool below to find specific information within the annual report.-
 1
1 -
2
-
3
-
4
-
5
-
6
-
7
-
8
-
9
-
10
-
11
-
12
-
13
-
14
-
15
-
16
-
17
-
18
-
19
-
20
-
21
-
22
-
23
-
24
-
 25
25 -
 26
26 -
 27
27 -
 28
28 -
 29
29 -
 30
30 -
 31
31 -
 32
32 -
 33
33 -
 34
34 -
 35
35 -
 36
36 -
 37
37 -
 38
38 -
 39
39 -
 40
40 -
 41
41 -
 42
42 -
 43
43 -
 44
44 -
 45
45 -
46
-
47
-
48
-
49
-
50
-
51
-
52
-
53
-
54
-
55
-
56
-
57
-
58
-
59
-
60
-
61
-
62
-
63
-
64
-
65
-
66
-
67
-
68
-
69
-
70
-
71
-
72
-
73
-
74
-
75
-
76
-
77
-
78
-
79
-
80
-
81
-
82
-
83
-
84
-
85
-
86
-
87
-
88
-
89
-
90
-
91
-
92
-
93
-
94
-
95
-
96
-
97
-
98
-
99
-
100
-
101
-
102
-
103
-
104
-
105
-
106
-
107
-
108
-
109
-
110
-
111
-
112
-
113
-
114
-
115
-
116
-
117
-
118
-
119
-
120
-
121
-
122
-
123
-
124
-
125
-
126
-
127
-
128
-
129
-
130
-
131
-
132
-
133
-
134
-
135
-
136
-
137
-
138
-
139
-
140
-
141
-
142
-
143
-
144
-
145
-
146
 |
 |

29
F
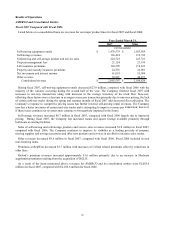
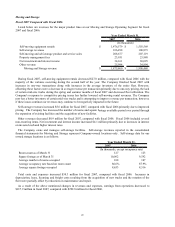
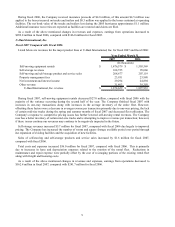
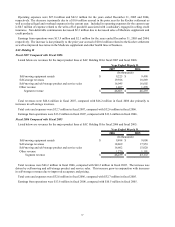
enues for the major product lines at our Moving and Storage Operating Segment for fiscal
2
Moving and Storage
iscal 2007 Compared with Fiscal 2006
Listed below are rev
007 and fiscal 2006:
2007 2006
Self-moving equipment rentals $ 1,476,579 $ 1,503,569
Self-storage revenues 106,498 100,873
Self-moving and self-storage product and service sales 208,677 207,119
Property management fees 23,951 23,988
Net investment and interest income 34,161 30,025
Other revenue 25,994 34,894
Moving and Storage revenue $ 1,875,860 $ 1,900,468
(In thousands)
Year Ended March 31,
transaction; however,
if
ootage available period over period through
th
terest income increased $4.1 million primarily due to increases in interest
o
torage represent Company-owned locations only. Self-storage data for our
During fiscal 2007, self-moving equipment rentals decreased $27.0 million, compared with fiscal 2006 with the
majority of the variance occurring during the second half of the year. The Company finished fiscal 2007 with
increases in one-way transactions along with increases in the average inventory of the entire fleet. However,
offsetting these factors were a decrease in average revenue per transaction primarily due to one-way pricing, the lack
of certain mid-size trucks during the spring and summer months of fiscal 2007 and decreased fleet utilization. The
Company’ s response to competitive pricing issues has further lowered self-moving rental revenues. The Company
now has a better inventory of certain mid-size trucks and is attempting to improve revenue per
these issues continue our revenues may continue to be negatively impacted in the future.
Self-storage revenues increased $5.6 million for fiscal 2007, compared with fiscal 2006 primarily due to improved
pricing. The Company has increased the number of rooms and square f
e expansion of existing facilities and the acquisition of new facilities.
Other revenues decreased $8.9 million for fiscal 2007, compared with fiscal 2006. Fiscal 2006 included several
non-recurring items. Net investment and in
n invested cash and higher interest rates.
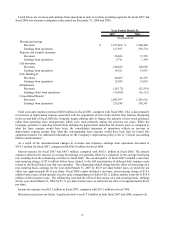
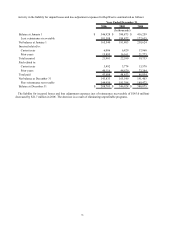
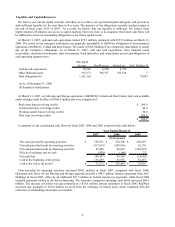
The Company owns and manages self-storage facilities. Self-storage revenues reported in the consolidated
financial statements for Moving and S
owned storage locations is as follows:
2007 2006
Room count as of March 31 127 123
Square footage as of March 31 10,062 9,592
Average number of rooms occupied 108 107
Average occupancy rate based on room count 86.6% 87.9%
Average square footage occupied 8,653 8,516
Year Ended March 31,
(In thousands, except occupancy rate)
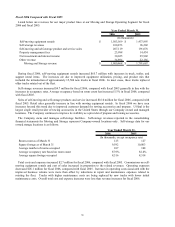
Total costs and expenses increased $50.3 million for fiscal 2007, compared with fiscal 2006. Increases in
depreciation, lease, licensing and freight costs resulting from the acquisition of new trucks and the rotation of the
fl
earnings from operations decreased to
$217.9 million in fiscal 2007, compared with $292.8 million for fiscal 2006.
eet were partially offset by reductions in maintenance and repair.
As a result of the above mentioned changes in revenues and expenses,