U-Haul 2007 Annual Report Download - page 22
Download and view the complete annual report
Please find page 22 of the 2007 U-Haul annual report below. You can navigate through the pages in the report by either clicking on the pages listed below, or by using the keyword search tool below to find specific information within the annual report.-
 1
1 -
2
-
3
-
4
-
5
-
6
-
7
-
8
-
9
-
10
-
11
-
 12
12 -
 13
13 -
 14
14 -
 15
15 -
 16
16 -
 17
17 -
 18
18 -
 19
19 -
 20
20 -
 21
21 -
 22
22 -
 23
23 -
 24
24 -
 25
25 -
 26
26 -
 27
27 -
 28
28 -
 29
29 -
 30
30 -
 31
31 -
 32
32 -
33
-
34
-
35
-
36
-
37
-
38
-
39
-
40
-
41
-
42
-
43
-
44
-
45
-
46
-
47
-
48
-
49
-
50
-
51
-
52
-
53
-
54
-
55
-
56
-
57
-
58
-
59
-
60
-
61
-
62
-
63
-
64
-
65
-
66
-
67
-
68
-
69
-
70
-
71
-
72
-
73
-
74
-
75
-
76
-
77
-
78
-
79
-
80
-
81
-
82
-
83
-
84
-
85
-
86
-
87
-
88
-
89
-
90
-
91
-
92
-
93
-
94
-
95
-
96
-
97
-
98
-
99
-
100
-
101
-
102
-
103
-
104
-
105
-
106
-
107
-
108
-
109
-
110
-
111
-
112
-
113
-
114
-
115
-
116
-
117
-
118
-
119
-
120
-
121
-
122
-
123
-
124
-
125
-
126
-
127
-
128
-
129
-
130
-
131
-
132
-
133
-
134
-
135
-
136
-
137
-
138
-
139
-
140
-
141
-
142
-
143
-
144
-
145
-
146
 |
 |

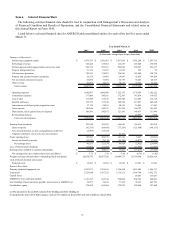
16
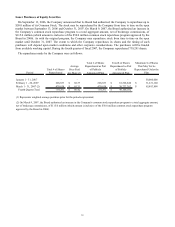
isted below is selected financial data for U-Haul International, Inc. for each of the last five years ended March 31:
(a) Fi 2006 includes a non-cash dividend to AMERCO in the amount of $1,200,000,000.
Year Ended March 31,
(In thousands)
L
2007 2006 2005 2004 2003
Summary of Operations:
Self-moving equipment rentals $ 1,476,579 $ 1,503,569 $ 1,437,895 $ 1,380,991 $ 1,293,686
Self-storage revenues 104,725 99,060 94,431 118,335 109,985
Self-moving and self-storage products and service sales 208,677 207,119 191,078 182,327 174,853
Property management fees 23,951 23,988 14,434 12,974 12,431
Net investment and interest income 29,294 24,894 22,030 21,504 29,358
Other revenue 31,403 39,303 27,489 35,580 18,378
Total revenues 1,874,629 1,897,933 1,787,357 1,751,711 1,638,691
Operating expenses 1,085,619 1,085,602 1,100,737 1,062,695 1,029,774
Commission expenses 186,233 189,599 181,315 176,165 166,334
Cost of sales 110,163 105,872 98,877 87,430 93,735
Lease expense 149,649 143,344 151,937 159,869 165,020
Depreciation, net of (gains) losses on disposal 180,560 131,803 114,038 125,093 112,815
Total costs and expenses 1,712,224 1,656,220 1,646,904 1,611,252 1,567,678
Earnings from operations 162,405 241,713 140,453 140,459 71,013
Interest income (expense) (114,051) (14,383) 15,687 8,560 (9,991)
Fees and amortization on early extinguishment of debt (302) - - - -
Pretax earnings 48,052 227,330
156,140 149,019 61,022
Income tax expense (17,948) (87,910) (59,160) (52,992) (21,211)
Net earnings $ 30,104 $ 139,420 $ 96,980 $ 96,027 $ 39,811
Balance Sheet Data:
Property, plant and equipment, net $ 1,231,932 $ 913,871 $ 796,361 $ 875,729 $ 736,499
Total assets 1,729,904 1,505,813 1,516,286 1,452,361 1,235,497
Capital leases - - - 99,607 14,793
Notes and loans payable 406,458 212,133 - - -
Stockholders' equity (deficit) (a) (336,705) (354,481) 701,198 601,514 499,380
scal