U-Haul 2007 Annual Report Download - page 46
Download and view the complete annual report
Please find page 46 of the 2007 U-Haul annual report below. You can navigate through the pages in the report by either clicking on the pages listed below, or by using the keyword search tool below to find specific information within the annual report.-
 1
1 -
2
-
3
-
4
-
5
-
6
-
7
-
8
-
9
-
10
-
11
-
12
-
13
-
14
-
15
-
16
-
17
-
18
-
19
-
20
-
21
-
22
-
23
-
24
-
25
-
26
-
27
-
28
-
29
-
30
-
31
-
32
-
33
-
34
-
35
-
 36
36 -
 37
37 -
 38
38 -
 39
39 -
 40
40 -
 41
41 -
 42
42 -
 43
43 -
 44
44 -
 45
45 -
 46
46 -
 47
47 -
 48
48 -
 49
49 -
 50
50 -
 51
51 -
 52
52 -
 53
53 -
 54
54 -
 55
55 -
 56
56 -
57
-
58
-
59
-
60
-
61
-
62
-
63
-
64
-
65
-
66
-
67
-
68
-
69
-
70
-
71
-
72
-
73
-
74
-
75
-
76
-
77
-
78
-
79
-
80
-
81
-
82
-
83
-
84
-
85
-
86
-
87
-
88
-
89
-
90
-
91
-
92
-
93
-
94
-
95
-
96
-
97
-
98
-
99
-
100
-
101
-
102
-
103
-
104
-
105
-
106
-
107
-
108
-
109
-
110
-
111
-
112
-
113
-
114
-
115
-
116
-
117
-
118
-
119
-
120
-
121
-
122
-
123
-
124
-
125
-
126
-
127
-
128
-
129
-
130
-
131
-
132
-
133
-
134
-
135
-
136
-
137
-
138
-
139
-
140
-
141
-
142
-
143
-
144
-
145
-
146
 |
 |
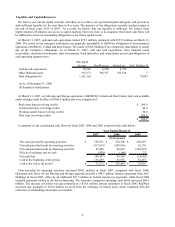
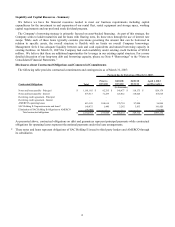
Oxford’ s stockholder’ s equity was $136.4 million, $127.3 million, and $115.0 million at December 31, 2006,
2005 and 2004, respectively. The increase resulted from earnings of $9.6 million offset by a $0.5 million decrease
in other comprehensive income. Oxford does not use debt or equity issues to increase cap
40
ital and therefore has no
l market conditions other than through its investment portfolio.
SA
AC Holding II loan
ubsidiary indebtedness.
ating Activities by Operating Segments
M
l $31.5 million in federal income tax payments,
to the debt refinancing.
P
RepWest’ s exiting its non U-Haul lines of business and the associated reduction of reserves in the lines
ex
ing budgets allow RepWest to schedule cash needs in
investment and underwriting proceeds.
L
The year ending December 31, 2005 includes
th
spectively. Management believes that
s of liquidity will continue to meet foreseeable cash needs.
S
es at SAC Holding II was $2.2 million, $2.8 million and $1.1 million for fiscal
2007, 2006 and 2005, respectively.
exposure to capita
C Holding II
SAC Holding II operations are funded by various mortgage loans, and secured and unsecured notes. SAC Holding
II does not utilize revolving lines of credit to finance its operations or acquisitions. Certain of S
agreements contain covenants and restrictions on incurring additional s
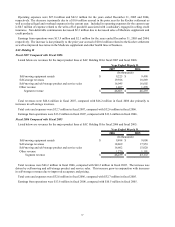
Cash Provided from Oper
oving and Self-Storage
Cash provided by operating activities was $331.7 million, $276.1 million and $226.5 million in fiscal 2007, 2006
and 2005, respectively. Operating cash flows for the Moving and Storage segment included a $40.7 million interest
repayment from SAC Holdings in fiscal 2007, offset by an additiona
while fiscal 2006 included payments related
roperty and Casualty Insurance
Cash provided (used) by operating activities was $5.4 million, ($28.9) million, and ($31.6) million for the years
ending December 31, 2006, 2005, and 2004, respectively. The decrease in cash used by operating activities was the
result of
ited.
RepWest’ s cash and cash equivalents and short-term investment portfolios was $71.9 million, $106.2 million, and
$90.3 million at December 31, 2006, 2005, and 2004, respectively. This balance reflects funds in transition from
maturity proceeds to long term investments. This level of liquid assets, combined with budgeted cash flow, is
adequate to meet periodic needs. Capital and operat
accordance with
ife Insurance
Cash provided (used) by operating activities from Oxford were $11.4 million, ($0.7) million and $24.8 million for
the years ending December 31, 2006, 2005 and 2004, respectively.
e $10.6 million settlement payment related to the Kocher lawsuit.
In addition to cash flows from operating activities, a substantial amount of liquid funds are available through
Oxford’ s short-term portfolio. At December 31, 2006, 2005 and 2004, cash and cash equivalents and short-term
investments amounted to $41.4 million, $37.0 million and $116.8 million, re
the overall source
AC Holding II
Cash provided by operating activiti