U-Haul 2007 Annual Report Download - page 31
Download and view the complete annual report
Please find page 31 of the 2007 U-Haul annual report below. You can navigate through the pages in the report by either clicking on the pages listed below, or by using the keyword search tool below to find specific information within the annual report.-
 1
1 -
2
-
3
-
4
-
5
-
6
-
7
-
8
-
9
-
10
-
11
-
12
-
13
-
14
-
15
-
16
-
17
-
18
-
19
-
20
-
 21
21 -
 22
22 -
 23
23 -
 24
24 -
 25
25 -
 26
26 -
 27
27 -
 28
28 -
 29
29 -
 30
30 -
 31
31 -
 32
32 -
 33
33 -
 34
34 -
 35
35 -
 36
36 -
 37
37 -
 38
38 -
 39
39 -
 40
40 -
 41
41 -
42
-
43
-
44
-
45
-
46
-
47
-
48
-
49
-
50
-
51
-
52
-
53
-
54
-
55
-
56
-
57
-
58
-
59
-
60
-
61
-
62
-
63
-
64
-
65
-
66
-
67
-
68
-
69
-
70
-
71
-
72
-
73
-
74
-
75
-
76
-
77
-
78
-
79
-
80
-
81
-
82
-
83
-
84
-
85
-
86
-
87
-
88
-
89
-
90
-
91
-
92
-
93
-
94
-
95
-
96
-
97
-
98
-
99
-
100
-
101
-
102
-
103
-
104
-
105
-
106
-
107
-
108
-
109
-
110
-
111
-
112
-
113
-
114
-
115
-
116
-
117
-
118
-
119
-
120
-
121
-
122
-
123
-
124
-
125
-
126
-
127
-
128
-
129
-
130
-
131
-
132
-
133
-
134
-
135
-
136
-
137
-
138
-
139
-
140
-
141
-
142
-
143
-
144
-
145
-
146
 |
 |

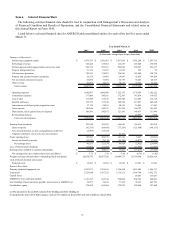
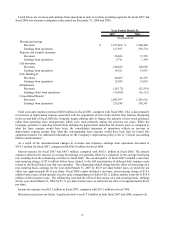
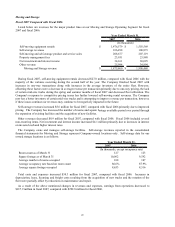
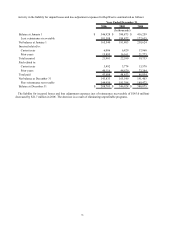
Listed below are revenues and earnings from operations at each of our four operati
25
ng segments for fiscal 2007 and
fiscal 2006, the insurance companies years ended are December 31, 2006 and 2005.
Earnings from operations 235,548 305,381
2007 2006
Moving and storage
Revenues $ 1,875,860 $ 1,900,468
Earnings from operations 217,937 292,774
Property and casualty insurance
Revenues 38,486 37,358
Earnings from operations 5,741 1,144
Life insurance
Revenues 148,820 148,080
Earnings from operations 14,521 13,933
SAC Holding II
Revenues 46,603 46,239
Earnings from operations 13,854 13,643
Eliminations
Revenues (24,172) (25,519)
Earnings (loss) from operations (16,505) (16,113)
Consolidated Results
Revenues 2,085,597 2,106,626
(In thousands)
Year Ended March 31,
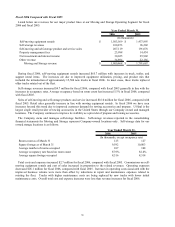
dditional information on the Company’ s depreciation policy refer to “Critical Accounting
P
rnings from operations decreased to
$
ended March 31, 2006 by $1.71 per share before taxes, in which the tax effect was approximately $0.63
p
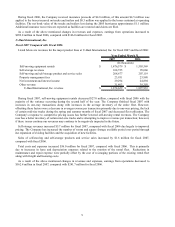
Dividends accrued on our Series A preferred stock were $13.0 million in both fiscal 2007 and 2006, respectively.
Total costs and expenses increased $48.8 million in fiscal 2007, compared with fiscal 2006. This is due primarily
to increases in depreciation expense associated with the acquisition of new trucks and the fleet rotation. Beginning
in the second half of fiscal 2006 the Company began utilizing debt to finance the majority of new truck purchases
rather than operating lease arrangements which were used primarily during the previous ten years. While the
Company generates a cash flow benefit from utilizing the depreciation deduction for income taxes as compared to
what the lease expense would have been, the consolidated statement of operations reflects an increase in
depreciation expense greater than what the corresponding lease expense would have been had we leased this
equipment instead. For a
olicies and Estimates”.
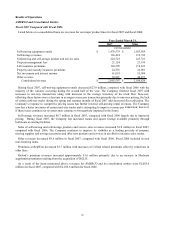
As a result of the aforementioned changes in revenues and expenses, ea
235.5 million for fiscal 2007, compared with $305.4 million for fiscal 2006.
Interest expense for fiscal 2007 was $89.7 million, compared with $105.1 million in fiscal 2006. The interest
expense related to the increase in average borrowings was partially offset by a reduction in the average borrowing
rate resulting from the refinancing activities in fiscal 2006. The second quarter of fiscal 2007 included a one-time,
non-recurring charge of $7.0 million before taxes related to the full amortization of deferred debt issuance costs
related to the Real Estate Loan that was amended. The refinancing related charge had the effect of decreasing on a
non-recurring basis, earnings for the year ended March 31, 2007 by $0.33 per share before taxes, in which the tax
effect was approximately $0.13 per share. Fiscal 2006 results included a one-time, non-recurring charge of $35.6
million before taxes which includes fees for early extinguishment of debt of $21.2 million and the write-off of $14.4
million of debt issuance costs. The refinancing costs had the effect of decreasing, on a non-recurring basis, earnings
for the year
er share.
Income tax expense was $55.3 million in fiscal 2007, compared with $79.1 million in fiscal 2006.