U-Haul 2007 Annual Report Download - page 50
Download and view the complete annual report
Please find page 50 of the 2007 U-Haul annual report below. You can navigate through the pages in the report by either clicking on the pages listed below, or by using the keyword search tool below to find specific information within the annual report.-
 1
1 -
2
-
3
-
4
-
5
-
6
-
7
-
8
-
9
-
10
-
11
-
12
-
13
-
14
-
15
-
16
-
17
-
18
-
19
-
20
-
21
-
22
-
23
-
24
-
25
-
26
-
27
-
28
-
29
-
30
-
31
-
32
-
33
-
34
-
35
-
36
-
37
-
38
-
39
-
 40
40 -
 41
41 -
 42
42 -
 43
43 -
 44
44 -
 45
45 -
 46
46 -
 47
47 -
 48
48 -
 49
49 -
 50
50 -
 51
51 -
 52
52 -
 53
53 -
 54
54 -
 55
55 -
 56
56 -
 57
57 -
 58
58 -
 59
59 -
 60
60 -
61
-
62
-
63
-
64
-
65
-
66
-
67
-
68
-
69
-
70
-
71
-
72
-
73
-
74
-
75
-
76
-
77
-
78
-
79
-
80
-
81
-
82
-
83
-
84
-
85
-
86
-
87
-
88
-
89
-
90
-
91
-
92
-
93
-
94
-
95
-
96
-
97
-
98
-
99
-
100
-
101
-
102
-
103
-
104
-
105
-
106
-
107
-
108
-
109
-
110
-
111
-
112
-
113
-
114
-
115
-
116
-
117
-
118
-
119
-
120
-
121
-
122
-
123
-
124
-
125
-
126
-
127
-
128
-
129
-
130
-
131
-
132
-
133
-
134
-
135
-
136
-
137
-
138
-
139
-
140
-
141
-
142
-
143
-
144
-
145
-
146
 |
 |

44
Q
r). The operating results for the periods presented are not necessarily
in cative of results for any future period.
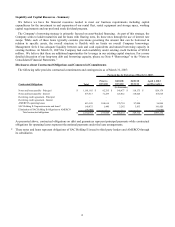
Basic and diluted $ (0.89) $ (0.61) $ 2.73 $ 2.49
Quarter Ended
(In thousands, except for share and per share data)
uarterly Results (unaudited)
The quarterly results shown below are derived from unaudited financial statements for the eight quarters
beginning April 1, 2005 and ending March 31, 2007. The Company believes that all necessary adjustments have
been included in the amounts stated below to present fairly, and in accordance with generally accepted accounting
principles, such results. Moving and Storage operations are seasonal and proportionally more of the Company’ s
revenues and net earnings from its Moving and Storage operations are generated in the first and second quarters of
each fiscal year (April through Septembe
di
March 31,
2007
December 31,
2006 (a)
September 30,
2006 (a), (b)
June 30,
2006 (a)
Total revenues $ 445,197 $ 466,838 $ 606,535 $ 567,027
Earnings (loss) from operations (8,774) 8,146 126,133 110,043
Net earnings (loss) (15,660) (9,551) 60,418 55,346
Earnings (loss) available to common
shareholders (18,900) (12,792) 57,177 52,105
Weighted average common shares
outstanding: basic and diluted 20,682,087 20,922,433 20,910,204 20,897,688
Earnings (loss) per common share
(a) The retroactive adoption of SAB 108 had the effect of decreasing operating and net earnings from amounts
previously reported by $0.1 million for each of the first three quarters of fiscal 2007. The Company determined that
the adjustment would not be material in any specific period and therefore did not restate historical financial
007 included a non-recurring amortization of $7.0 million, pre-tax on deferred
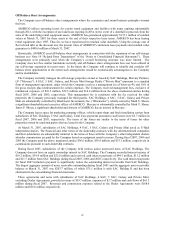
Basic and diluted $ (0.07) $ 0.57 $ 3.16 $ 1.53
Quarter Ended
(In thousands, except for share and per share data)
statements. See discussion under “Adoption of New Accounting Pronouncements”.
(b) The second quarter fiscal 2
charges related to a refinancing.
March 31,
2006
December 31,
2005
September 30,
2005
June 30,
2005 (c)
Total revenues $ 445,982 $ 495,670 $ 605,516 $ 559,458
Earnings from operations 19,164 45,419 128,238 112,560
Net earnings 1,800 15,170 69,122 35,062
Earnings (loss) available to common
shareholders (1,440) 11,929 65,881 31,821
Weighted average common shares
outstanding: basic and diluted 20,887,258 20,865,684 20,848,620 20,836,458
Earnings (loss) per common share
urring fee of $21.2 million on early extinguishment of
debt and a write-off of $14.4 million of debt issuance costs.
(c) The first quarter fiscal 2006 results included a non-rec