U-Haul 2007 Annual Report Download - page 33
Download and view the complete annual report
Please find page 33 of the 2007 U-Haul annual report below. You can navigate through the pages in the report by either clicking on the pages listed below, or by using the keyword search tool below to find specific information within the annual report.-
 1
1 -
2
-
3
-
4
-
5
-
6
-
7
-
8
-
9
-
10
-
11
-
12
-
13
-
14
-
15
-
16
-
17
-
18
-
19
-
20
-
21
-
22
-
 23
23 -
 24
24 -
 25
25 -
 26
26 -
 27
27 -
 28
28 -
 29
29 -
 30
30 -
 31
31 -
 32
32 -
 33
33 -
 34
34 -
 35
35 -
 36
36 -
 37
37 -
 38
38 -
 39
39 -
 40
40 -
 41
41 -
 42
42 -
 43
43 -
44
-
45
-
46
-
47
-
48
-
49
-
50
-
51
-
52
-
53
-
54
-
55
-
56
-
57
-
58
-
59
-
60
-
61
-
62
-
63
-
64
-
65
-
66
-
67
-
68
-
69
-
70
-
71
-
72
-
73
-
74
-
75
-
76
-
77
-
78
-
79
-
80
-
81
-
82
-
83
-
84
-
85
-
86
-
87
-
88
-
89
-
90
-
91
-
92
-
93
-
94
-
95
-
96
-
97
-
98
-
99
-
100
-
101
-
102
-
103
-
104
-
105
-
106
-
107
-
108
-
109
-
110
-
111
-
112
-
113
-
114
-
115
-
116
-
117
-
118
-
119
-
120
-
121
-
122
-
123
-
124
-
125
-
126
-
127
-
128
-
129
-
130
-
131
-
132
-
133
-
134
-
135
-
136
-
137
-
138
-
139
-
140
-
141
-
142
-
143
-
144
-
145
-
146
 |
 |

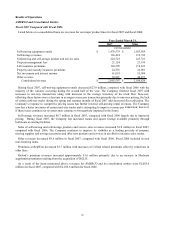
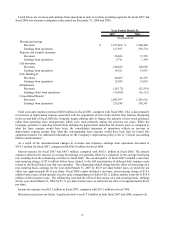
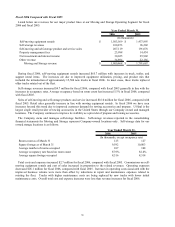
Listed below are revenues and earnings (loss) from operations at each of our four operating s
27
egments for fiscal
006 and fiscal 2005; for the insurance companies years ended are December 31, 2005 and 2004:
2
2006 2005
Moving and storage
Revenues $ 1,900,468 $ 1,791,667
Earnings from operations 292,774 165,985
Property and casualty insurance
Revenues 37,358 41,417
Earnings (loss) from operations 1,144 (14,814)
Life insurance
Revenues 148,080 159,484
Earnings from operations 13,933 2,065
SAC Holding II
Revenues 46,239 43,172
Earnings from operations 13,643 10,466
Eliminations
Revenues (25,519) (27,619)
Earnings (loss) from operations (16,113) 3,294
Consolidated Results
Revenues 2,106,626 2,008,121
Earnings from operations 305,381 166,996
Year Ended March 31,
(In thousands)
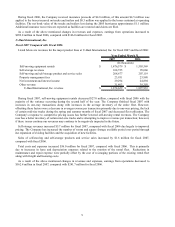
Total costs and expenses decreased $39.9 million for fiscal 2006, compared with fiscal 2005. Total costs and
expenses for both insurance companies decreased $43.3 million due primarily to reductions in benefits and losses.
Fiscal 2005 included a $10.6 million charge for litigation at Oxford not present in fiscal 2006. Increases in
operating costs associated with the improved business volume at Moving and Storage were offset by reductions in
repair and maintenance expenses related to rotating the fleet. Trucks with higher maintenance costs are being
re
of catastrophic events. Our insurance deductible is $500,000 and was recorded in our
se
imates $1.1 million.
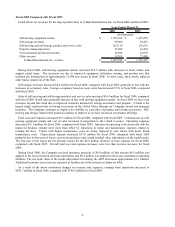
A
ngs from operations improved to $305.4
m
ended March 31, 2006 by $1.71 per share before taxes, in which the tax effect
was approximately $0.63 per share.
placed by new trucks with lower initial maintenance costs.
In our second quarter of fiscal 2006, hurricanes Katrina and Rita struck the Gulf Coast of the United States
causing business interruption to a number of our operating facilities. We identified customers impacted by the
hurricanes and our rapid response teams provided a variety of solutions to divert operations to alternate facilities and
restore operations where possible. We lost approximately 150 trucks and 150 trailers during and after the devastation
caused by these hurricanes. We maintain property and business interruption insurance coverage to mitigate the
financial impact of these types
cond quarter of fiscal 2006.
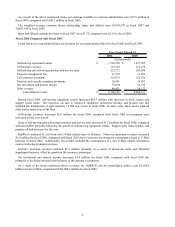
During fiscal 2006, the Company received insurance proceeds of $4.8 million, of this amount $4.5 million was
applied to the losses incurred on trucks and trailers and $0.3 million was applied to the losses sustained at operating
facilities. The net book value of the trucks and trailers lost during the 2005 hurricanes approx
dditional insurance recoveries are expected as facilities are fully restored and claims are filed.
As a result of the aforementioned changes in revenues and expenses, earni
illion for fiscal 2006, compared with $167.0 million for fiscal 2005.
Interest expense for fiscal 2006 was $105.1 million, compared with $73.2 million in fiscal 2005. Fiscal 2006
results included a one-time, non-recurring charge of $35.6 million before taxes which includes fees for early
extinguishment of debt of $21.2 million and the write-off of $14.4 million of debt issuance costs. The expense
related to the increase in average borrowings was partially offset by a reduction in the average borrowing rate
resulting from the refinancing activities in fiscal 2006. The refinancing costs had the effect of decreasing, on a non-
recurring basis, earnings for the year