U-Haul 2007 Annual Report Download - page 36
Download and view the complete annual report
Please find page 36 of the 2007 U-Haul annual report below. You can navigate through the pages in the report by either clicking on the pages listed below, or by using the keyword search tool below to find specific information within the annual report.-
 1
1 -
2
-
3
-
4
-
5
-
6
-
7
-
8
-
9
-
10
-
11
-
12
-
13
-
14
-
15
-
16
-
17
-
18
-
19
-
20
-
21
-
22
-
23
-
24
-
25
-
 26
26 -
 27
27 -
 28
28 -
 29
29 -
 30
30 -
 31
31 -
 32
32 -
 33
33 -
 34
34 -
 35
35 -
 36
36 -
 37
37 -
 38
38 -
 39
39 -
 40
40 -
 41
41 -
 42
42 -
 43
43 -
 44
44 -
 45
45 -
 46
46 -
47
-
48
-
49
-
50
-
51
-
52
-
53
-
54
-
55
-
56
-
57
-
58
-
59
-
60
-
61
-
62
-
63
-
64
-
65
-
66
-
67
-
68
-
69
-
70
-
71
-
72
-
73
-
74
-
75
-
76
-
77
-
78
-
79
-
80
-
81
-
82
-
83
-
84
-
85
-
86
-
87
-
88
-
89
-
90
-
91
-
92
-
93
-
94
-
95
-
96
-
97
-
98
-
99
-
100
-
101
-
102
-
103
-
104
-
105
-
106
-
107
-
108
-
109
-
110
-
111
-
112
-
113
-
114
-
115
-
116
-
117
-
118
-
119
-
120
-
121
-
122
-
123
-
124
-
125
-
126
-
127
-
128
-
129
-
130
-
131
-
132
-
133
-
134
-
135
-
136
-
137
-
138
-
139
-
140
-
141
-
142
-
143
-
144
-
145
-
146
 |
 |

30
F
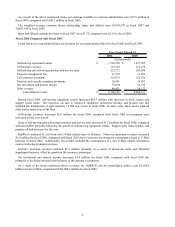
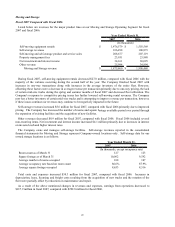
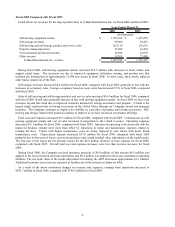
enues for our major product lines at our Moving and Storage Operating Segment for fiscal
2
iscal 2006 Compared with Fiscal 2005
Listed below are rev
006 and fiscal 2005:
2006 2005
Self-moving equipment rentals $ 1,503,569 $ 1,437,895
Self-storage revenues 100,873 96,202
Self-moving and self-storage product and service sales 207,119 191,078
Property management fees 23,988 14,434
Net investment and interest income 30,025 29,902
Other revenue 34,894 22,156
Moving and Storage revenue $ 1,900,468 $ 1,791,667
Year Ended March 31,
(In thousands)
ately 15,500 new trucks in fiscal 2006. In most cases, these trucks replaced
ol
ancy rates. Average occupancy based on room count has increased 5.5% in fiscal 2006, compared
w
anaged
lo
torage represent Company-owned locations only. Self-storage data for our
During fiscal 2006, self-moving equipment rentals increased $65.7 million with increases in truck, trailer, and
support rental items. The increases are due to improved equipment utilization, pricing, and product mix that
included the introduction of approxim
der trucks rotated out of the fleet.
Self-storage revenues increased $4.7 million for fiscal 2006, compared with fiscal 2005 generally in line with the
increases in occup
ith fiscal 2005.
Sales of self-moving and self-storage products and service increased $16.0 million for fiscal 2006, compared with
fiscal 2005. Retail sales generally increase in line with moving equipment rentals. In fiscal 2006 we have seen
increases beyond this trend due to improved customer demand for towing accessories and propane. U-Haul is the
largest single retail provider of towing accessories in the United States through our Company owned and m
cations. The Company continues to improve its visibility as a provider of propane and towing accessories.
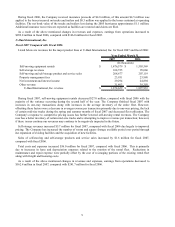
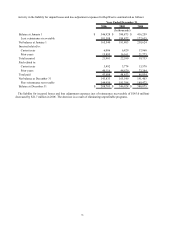
The Company owns and manages self-storage facilities. Self-storage revenues reported in the consolidating
financial statements for Moving and S
owned storage locations is as follows:
2006 2005
Room count as of March 31 123 127
Square footage as of March 31 9,592 10,003
Average number of rooms occupied 107 108
Average occupancy rate based on room count 87.9% 82.4%
Average square footage occupied 8,516 8,514
Year Ended March 31,
(In thousands, except occupancy rate)
Total costs and expenses increased $2.7 million for fiscal 2006, compared with fiscal 2005. Commissions on self-
moving equipment rentals and cost of sales increased in proportion to the related revenues. Operating expenses
decreased $26.1 million for fiscal 2006, compared with fiscal 2005. Increases in operating costs associated with the
improved business volume were more than offset by reductions in repair and maintenance expenses related to
rotating the fleet. Trucks with higher maintenance costs are being replaced by new trucks with lower initial
maintenance costs. Overall total cost and expense increases were less than revenue increases for fiscal 2006.