Tyson Foods 2009 Annual Report Download - page 74
Download and view the complete annual report
Please find page 74 of the 2009 Tyson Foods annual report below. You can navigate through the pages in the report by either clicking on the pages listed below, or by using the keyword search tool below to find specific information within the annual report.-
 1
1 -
2
-
3
-
4
-
5
-
6
-
7
-
8
-
9
-
10
-
11
-
12
-
13
-
14
-
15
-
16
-
17
-
18
-
19
-
20
-
21
-
22
-
23
-
24
-
25
-
26
-
27
-
28
-
29
-
30
-
31
-
32
-
33
-
34
-
35
-
36
-
37
-
38
-
39
-
40
-
41
-
42
-
43
-
44
-
45
-
46
-
47
-
48
-
49
-
50
-
51
-
52
-
53
-
54
-
55
-
56
-
57
-
58
-
59
-
60
-
61
-
62
-
63
-
 64
64 -
 65
65 -
 66
66 -
 67
67 -
 68
68 -
 69
69 -
 70
70 -
 71
71 -
 72
72 -
 73
73 -
 74
74 -
 75
75 -
 76
76 -
 77
77 -
 78
78 -
 79
79 -
 80
80 -
 81
81 -
 82
82 -
 83
83 -
 84
84 -
85
-
86
-
87
-
88
-
89
-
90
-
91
-
92
 |
 |

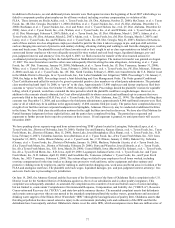
74
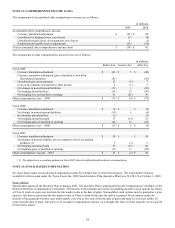
in millions
Chicken
Beef
Pork
Prepared
Foods
Other
Consolidated
Fiscal year ended October 3, 2009
Sales
$
9,660
$
10,782
$
3,426
$
2,836
$
-
$
26,704
Operating income (loss)
(157
)
(346
)
160
133
(5
)
(215
)
Other expense
311
Loss from continuing operations
before income taxes and minority interest
(526
)
Depreciation
252
103
36
54
-
445
Total assets
4,927
2,277
840
905
1,646
l0,595
Additions to property, plant and equipment
174
39
18
58
79
368
Fiscal year ended September 27, 2008
Sales
$
8,900
$
11,664
$
3,587
$
2,711
$
-
$
26,862
Operating income (loss)
(118
)
106
280
63
-
331
Other expense
177
Income from continuing operations
before income taxes and minority interest
154
Depreciation (a)
244
117
31
67
-
459
Total assets (b)
4,990
3,169
898
971
663
10,691
Additions to property, plant and equipment (c)
258
83
21
46
15
423
Fiscal year ended September 29, 2007
Sales
$
8,210
$
11,540
$
3,314
$
2,665
$
-
$
25,729
Operating income
325
51
145
92
-
613
Other expense
203
Income from continuing operations
before income taxes and minority interest
410
Depreciation (a)
260
120
31
61
-
472
Total assets (b)
4,467
3,207
814
961
614
10,063
Additions to property, plant and equipment (c)
164
33
10
25
47
279
a)
Excludes depreciation related to discontinued operation of $9 million and $10 million for fiscal years 2008 and 2007, respectively.
b)
Excludes assets held for sale related to discontinued operation of $159 million and $164 million for fiscal years 2008 and 2007, respectively.
c)
Excludes additions to property, plant and equipment related to discontinued operation of $2 million and $6 million for fiscal years 2008 and
2007, respectively.
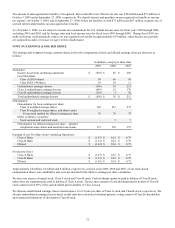
We allocate expenses related to corporate activities to the segments, while the related assets and additions to property, plant and
equipment remain in Other.
The Pork segment had sales of $449 million, $517 million and $515 million for fiscal years 2009, 2008 and 2007, respectively, from
transactions with other operating segments. The Beef segment had sales of $155 million, $142 million and $111 million for fiscal
years 2009, 2008 and 2007, respectively, from transactions with other operating segments. These sales from intersegment
transactions, which are sold at market prices, were excluded from the segment sales in the above table.
Our largest customer, Wal-Mart Stores, Inc., accounted for 13.8%, 13.3% and 13.4% of consolidated sales in fiscal years 2009, 2008
and 2007, respectively. Sales to Wal-Mart Stores, Inc. were included in the Chicken, Beef, Pork and Prepared Foods segments. Any
extended discontinuance of sales to this customer could, if not replaced, have a material impact on our operations.
The majority of our operations are domiciled in the United States. Approximately 97%, 98% and 98% of sales to external customers
for fiscal 2009, 2008 and 2007, respectively, were sourced from the United States. Approximately $3.2 billion, $3.4 billion and $3.5
billion, respectively, of property, plant and equipment were located in the United States at October 3, 2009, September 27, 2008, and
September 29, 2007. Approximately $329 million, $139 million and $125 million of property, plant and equipment were located in
foreign countries, primarily Brazil, China and Mexico, at fiscal years ended 2009, 2008 and 2007, respectively.
We sell certain products in foreign markets, primarily Canada, Central America, China, the European Union, Japan, Mexico, the
Middle East, Russia, South Korea, Taiwan and Vietnam. Our export sales totaled $2.7 billion, $3.2 billion and $2.5 billion for fiscal
2009, 2008 and 2007, respectively. Substantially all of our export sales are facilitated through unaffiliated brokers, marketing
associations and foreign sales staffs. Foreign sales, which are sales of products produced in a country other than the United
States, were less than 10% of consolidated sales for each of fiscal 2009, 2008 and 2007. Approximately 3%, 22% and 10% of income
(loss) from continuing operations before income taxes and minority interest for fiscal 2009, 2008 and 2007, respectively, was from
foreign operations.