Tyson Foods 2009 Annual Report Download - page 20
Download and view the complete annual report
Please find page 20 of the 2009 Tyson Foods annual report below. You can navigate through the pages in the report by either clicking on the pages listed below, or by using the keyword search tool below to find specific information within the annual report.-
 1
1 -
2
-
3
-
4
-
5
-
6
-
7
-
8
-
9
-
 10
10 -
 11
11 -
 12
12 -
 13
13 -
 14
14 -
 15
15 -
 16
16 -
 17
17 -
 18
18 -
 19
19 -
 20
20 -
 21
21 -
 22
22 -
 23
23 -
 24
24 -
 25
25 -
 26
26 -
 27
27 -
 28
28 -
 29
29 -
 30
30 -
31
-
32
-
33
-
34
-
35
-
36
-
37
-
38
-
39
-
40
-
41
-
42
-
43
-
44
-
45
-
46
-
47
-
48
-
49
-
50
-
51
-
52
-
53
-
54
-
55
-
56
-
57
-
58
-
59
-
60
-
61
-
62
-
63
-
64
-
65
-
66
-
67
-
68
-
69
-
70
-
71
-
72
-
73
-
74
-
75
-
76
-
77
-
78
-
79
-
80
-
81
-
82
-
83
-
84
-
85
-
86
-
87
-
88
-
89
-
90
-
91
-
92
 |
 |

20
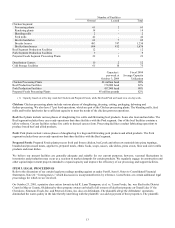
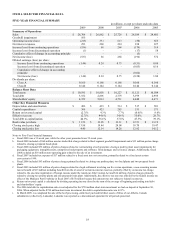
in millions, except per share data
2009
2008
2007
Net income (loss)
$
(537
)
$
86
$
268
Net income (loss) per diluted share
(1.44
)
0.24
0.75
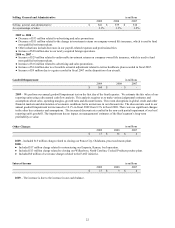
2009 – Net loss includes the following items:
●
$560 million non-cash, non-tax deductible charge related to a goodwill impairment in our Beef segment; and
●
$15 million charge related to the closing of our Ponca City, Oklahoma, processed meats plant.
2008 – Net income includes the following items:
●
$33 million of charges related to asset impairments, including packaging equipment, intangible assets, unimproved real
property and software;
●
$17 million charge related to restructuring our Emporia, Kansas, beef operation;
●
$13 million charge related to closing our Wilkesboro, North Carolina, Cooked Products poultry plant;
●
$13 million of charges related to flood damage at our Jefferson, Wisconsin, plant and severance charges related to the
FAST initiative; and
●
$18 million non-operating gain related to sale of an investment.
2007 – Net income includes the following item:
●
$17 million of tax expense related to a fixed asset tax cost correction, primarily related to a fixed asset system conversion
in 1999.
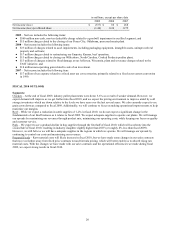
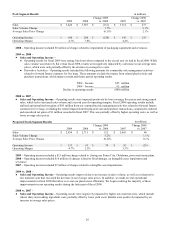
FISCAL 2010 OUTLOOK
Segments:
Chicken – At the end of fiscal 2009, industry pullet placements were down 5-6% as a result of weaker demand. However, we
expect demand will improve as we get further into fiscal 2010, and we expect the pricing environment to improve aided by cold
storage inventories which are down relative to the levels we have seen over the last several years. We also currently expect to see
grain costs down as compared to fiscal 2009. Additionally, we will continue to focus on making operational improvements to help
maximize our margins.
Beef – While we expect a reduction in cattle supplies of 1-2% in fiscal 2010, we do not expect a significant change in the
fundamentals of our Beef business as it relates to fiscal 2009. We expect adequate supplies to operate our plants. We will manage
our spreads by maximizing our revenues through product mix, minimizing our operating costs, while keeping our focus on quality
and customer service.
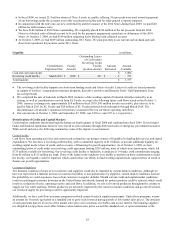
Pork – We expect to see a gradual decline in hog supplies through the first half of fiscal 2010, which will accelerate into the
second half of fiscal 2010, resulting in industry slaughter slightly higher than 2007 (or roughly 4% less than fiscal 2009).
However, we still believe we will have adequate supplies in the regions in which we operate. We will manage our spreads by
continuing to control our costs and maximizing our revenues.
Prepared Foods – Raw material costs will likely increase in fiscal 2010, but we have made some changes in our sales contracts
that move us further away from fixed price contracts toward formula pricing, which will better enable us to absorb rising raw
material costs. With the changes we have made with our sales contracts and the operational efficiencies we made during fiscal
2009, we expect strong results in fiscal 2010.