Tyson Foods 2009 Annual Report Download - page 22
Download and view the complete annual report
Please find page 22 of the 2009 Tyson Foods annual report below. You can navigate through the pages in the report by either clicking on the pages listed below, or by using the keyword search tool below to find specific information within the annual report.-
 1
1 -
2
-
3
-
4
-
5
-
6
-
7
-
8
-
9
-
10
-
11
-
 12
12 -
 13
13 -
 14
14 -
 15
15 -
 16
16 -
 17
17 -
 18
18 -
 19
19 -
 20
20 -
 21
21 -
 22
22 -
 23
23 -
 24
24 -
 25
25 -
 26
26 -
 27
27 -
 28
28 -
 29
29 -
 30
30 -
 31
31 -
 32
32 -
33
-
34
-
35
-
36
-
37
-
38
-
39
-
40
-
41
-
42
-
43
-
44
-
45
-
46
-
47
-
48
-
49
-
50
-
51
-
52
-
53
-
54
-
55
-
56
-
57
-
58
-
59
-
60
-
61
-
62
-
63
-
64
-
65
-
66
-
67
-
68
-
69
-
70
-
71
-
72
-
73
-
74
-
75
-
76
-
77
-
78
-
79
-
80
-
81
-
82
-
83
-
84
-
85
-
86
-
87
-
88
-
89
-
90
-
91
-
92
 |
 |

22
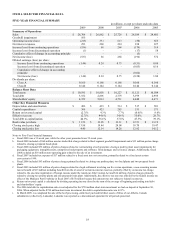
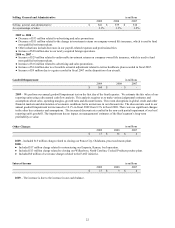
Selling, General and Administrative
in millions
2009
2008
2007
Selling, general and administrative
$
841
$
879
$
814
As a percentage of sales
3.1
%
3.3
%
3.2
%
2009 vs. 2008 –
●
Decrease of $33 million related to advertising and sales promotions.
●
Decrease of $11 million related to the change in investment returns on company-owned life insurance, which is used to fund
non-qualified retirement plans.
●
Other reductions include decreases in our payroll-related expenses and professional fees.
●
Increase of $20 million due to our newly acquired foreign operations.
2008 vs. 2007 –
●
Increase of $29 million related to unfavorable investment returns on company-owned life insurance, which is used to fund
non-qualified retirement plans.
●
Increase of $16 million related to advertising and sales promotions.
●
Increase of $14 million due to a favorable actuarial adjustment related to retiree healthcare plan recorded in fiscal 2007.
●
Increase of $9 million due to a gain recorded in fiscal 2007 on the disposition of an aircraft.
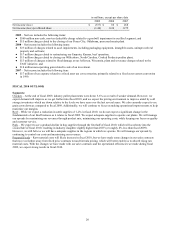
Goodwill Impairment
in millions
2009
2008
2007
$
560
$
-
$
-
2009 – We perform our annual goodwill impairment test on the first day of the fourth quarter. We estimate the fair value of our
reporting units using a discounted cash flow analysis. This analysis requires us to make various judgmental estimates and
assumptions about sales, operating margins, growth rates and discount factors. The recent disruptions in global credit and other
financial markets and deterioration of economic conditions led to an increase in our discount rate. The discount rate used in our
annual goodwill impairment test increased to 10.1% in fiscal 2009 from 9.3% in fiscal 2008. There were no significant changes
in the other key estimates and assumptions. The increased discount rate resulted in the non-cash partial impairment of our beef
reporting unit's goodwill. The impairment has no impact on managements' estimates of the Beef segment’s long-term
profitability or value.
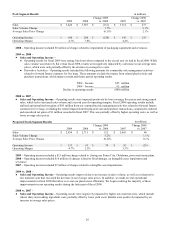
Other Charges
in millions
2009
2008
2007
$
17
$
36
$
2
2009 – Included $15 million charge related to closing our Ponca City, Oklahoma, processed meats plant.
2008 –
●
Included $17 million charge related to restructuring our Emporia, Kansas, beef operation.
●
Included $13 million charge related to closing our Wilkesboro, North Carolina, Cooked Products poultry plant.
●
Included $6 million of severance charges related to the FAST initiative.
Interest Income
in millions
2009
2008
2007
$
17
$
9
$
8
2009 – The increase is due to the increase in our cash balance.