Tyson Foods 2009 Annual Report Download - page 24
Download and view the complete annual report
Please find page 24 of the 2009 Tyson Foods annual report below. You can navigate through the pages in the report by either clicking on the pages listed below, or by using the keyword search tool below to find specific information within the annual report.-
 1
1 -
2
-
3
-
4
-
5
-
6
-
7
-
8
-
9
-
10
-
11
-
12
-
13
-
 14
14 -
 15
15 -
 16
16 -
 17
17 -
 18
18 -
 19
19 -
 20
20 -
 21
21 -
 22
22 -
 23
23 -
 24
24 -
 25
25 -
 26
26 -
 27
27 -
 28
28 -
 29
29 -
 30
30 -
 31
31 -
 32
32 -
 33
33 -
 34
34 -
35
-
36
-
37
-
38
-
39
-
40
-
41
-
42
-
43
-
44
-
45
-
46
-
47
-
48
-
49
-
50
-
51
-
52
-
53
-
54
-
55
-
56
-
57
-
58
-
59
-
60
-
61
-
62
-
63
-
64
-
65
-
66
-
67
-
68
-
69
-
70
-
71
-
72
-
73
-
74
-
75
-
76
-
77
-
78
-
79
-
80
-
81
-
82
-
83
-
84
-
85
-
86
-
87
-
88
-
89
-
90
-
91
-
92
 |
 |

24
SEGMENT RESULTS
We operate in four segments: Chicken, Beef, Pork and Prepared Foods. The following table is a summary of sales and operating
income (loss), which is how we measure segment income (loss). Segment results exclude the results of our discontinued operation,
Lakeside.
in millions
Sales
Operating Income (Loss)
2009
2008
2007
2009
2008
2007
Chicken
$
9,660
$
8,900
$
8,210
$
(157
)
$
(118
)
$
325
Beef
10,782
11,664
11,540
(346
)
106
51
Pork
3,426
3,587
3,314
160
280
145
Prepared Foods
2,836
2,711
2,665
133
63
92
Other
-
-
-
(5
)
-
-
Total
$
26,704
$
26,862
$
25,729
$
(215
)
$
331
$
613
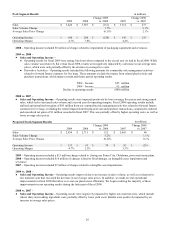
Chicken Segment Results
in millions
2009
2008
Change 2009
vs. 2008
2007
Change 2008
vs. 2007
Sales
$
9,660
$
8,900
$
760
$
8,210
$
690
Sales Volume Change
8.8
%
(0.4
)%
Average Sales Price Change
(0.2
)%
8.9
%
Operating Income (Loss)
$
(157
)
$
(118
)
$
(39
)
$
325
$
(443
)
Operating Margin
(1.6
)%
(1.3
)%
4.0
%
2008 – Operating loss included $26 million of charges related to: plant closings; impairments of unimproved real property and
software; and severance.
2007 – Operating income included a $10 million gain on the sale of two poultry plants and related support facilities.
2009 vs. 2008 –
●
Sales Volume – The increase in sales volume for fiscal 2009 was due to the extra week in fiscal 2009, as well as inventory
reductions and sales volume related to recent acquisitions.
●
Average Sales Price – The inventory reductions and recent acquisitions lowered the average sales price, as most of the
inventory reduction related to commodity products shipped internationally and sales volume from recent acquisitions was
on lower priced products.
●
Operating Loss –
●
Operational Improvements – Operating results were positively impacted by operational improvements, which included:
yield, mix and live production performance improvements; additional processing flexibility; and reduced interplant
product movement.
●
Derivative Activities – Operating results included the following amounts for commodity risk management activities
related to grain and energy purchases. These amounts exclude the impact from related physical purchase transactions,
which impact current and future period operating results.
2009 – Loss
$(257) million
2008 – Income
206 million
Decline in operating results
$(463) million
●
SG&A Expenses – We reduced our selling, general and administrative expenses during fiscal 2009 by approximately
$37 million.
●
Grain Costs – Operating results were positively impacted in fiscal 2009 by a decrease in grain costs of $28 million.
2008 vs. 2007 –
●
Sales and Operating Income (Loss) – Sales increased as a result of an increase in average sales prices, partially offset by
a decrease in sales volume due to the sale of two poultry plants in fiscal 2007. Operating results were adversely impacted
by increased input costs of approximately $900 million, including grain costs, other feed ingredient costs and cooking
ingredients. Plant costs, including labor and logistics, increased by approximately $200 million. This was partially offset by
increased net gains of $127 million from our commodity trading risk management activities related to grain purchases,
which exclude the impact from related physical purchase transactions which impact current and future period operating
results. Operating results were also negatively impacted by increased selling, general and administrative expenses of $43
million.