Tyson Foods 2009 Annual Report Download - page 58
Download and view the complete annual report
Please find page 58 of the 2009 Tyson Foods annual report below. You can navigate through the pages in the report by either clicking on the pages listed below, or by using the keyword search tool below to find specific information within the annual report.-
 1
1 -
2
-
3
-
4
-
5
-
6
-
7
-
8
-
9
-
10
-
11
-
12
-
13
-
14
-
15
-
16
-
17
-
18
-
19
-
20
-
21
-
22
-
23
-
24
-
25
-
26
-
27
-
28
-
29
-
30
-
31
-
32
-
33
-
34
-
35
-
36
-
37
-
38
-
39
-
40
-
41
-
42
-
43
-
44
-
45
-
46
-
47
-
 48
48 -
 49
49 -
 50
50 -
 51
51 -
 52
52 -
 53
53 -
 54
54 -
 55
55 -
 56
56 -
 57
57 -
 58
58 -
 59
59 -
 60
60 -
 61
61 -
 62
62 -
 63
63 -
 64
64 -
 65
65 -
 66
66 -
 67
67 -
 68
68 -
69
-
70
-
71
-
72
-
73
-
74
-
75
-
76
-
77
-
78
-
79
-
80
-
81
-
82
-
83
-
84
-
85
-
86
-
87
-
88
-
89
-
90
-
91
-
92
 |
 |

58
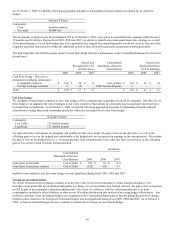
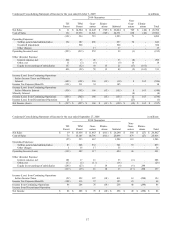
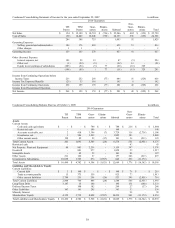
Condensed Consolidating Statement of Income for the year ended September 29, 2007
in millions
2014 Guarantors
TFI
Parent
TFM
Parent
Guar-
antors
Elimin-
ations
Subtotal
Non-
Guar-
antors
Elimin-
ations
Total
Net Sales
$
154
$
15,189
$
10,793
$
(736
)
$
25,246
$
482
$
(153
)
$
25,729
Cost of Sales
(90
)
14,849
10,040
(736
)
24,153
390
(153
)
24,300
244
340
753
-
1,093
92
-
1,429
Operating Expenses:
Selling, general and administrative
104
176
483
-
659
51
-
814
Other charges
1
1
-
-
1
-
-
2
Operating Income
139
163
270
-
433
41
-
613
Other (Income) Expense:
Interest expense, net
186
29
18
-
47
(9
)
-
224
Other, net
(1
)
(24
)
(8
)
-
(32
)
12
-
(21
)
Equity in net earnings of subsidiaries
(285
)
(94
)
(9
)
77
(26
)
(18
)
329
-
(100
)
(89
)
1
77
(11
)
(15
)
329
203
Income from Continuing Operations before
Income Taxes
239
252
269
(77
)
444
56
(329
)
410
Income Tax Expense (Benefit)
(29
)
53
110
-
163
8
-
142
Income from Continuing Operations
268
199
159
(77
)
281
48
(329
)
268
Income from Discontinued Operation
-
-
-
-
-
-
-
-
Net Income
$
268
$
199
$
159
$
(77
)
$
281
$
48
$
(329
)
$
268
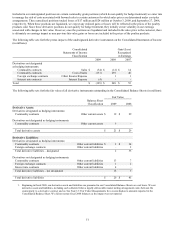
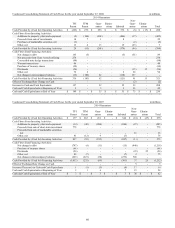
Condensed Consolidating Balance Sheet as of October 3, 2009
in millions
2014 Guarantors
TFI
Parent
TFM
Parent
Guar-
antors
Elimin-
ations
Subtotal
Non-
Guar-
antors
Elimin-
ations
Total
Assets
Current Assets:
Cash and cash equivalents
$
-
$
-
$
788
$
-
$
788
$
216
$
-
$
1,004
Restricted cash
-
-
140
-
140
-
-
140
Accounts receivable, net
2
418
3,309
(7
)
3,720
116
(2,738
)
1,100
Inventories, net
1
586
1,239
-
1,825
183
-
2,009
Other current assets
198
89
29
(17
)
101
36
(213
)
122
Total Current Assets
201
1,093
5,505
(24
)
6,574
551
(2,951
)
4,375
Restricted cash
-
-
-
-
-
43
-
43
Net Property, Plant and Equipment
40
883
2,256
-
3,139
397
-
3,576
Goodwill
-
881
977
-
1,858
59
-
1,917
Intangible Assets
-
42
59
-
101
86
-
187
Other Assets
211
120
37
-
157
346
(217
)
497
Investment in Subsidiaries
10,038
1,763
674
(1,597
)
840
296
(11,174
)
-
Total Assets
$
10,490
$
4,782
$
9,508
$
(1,621
)
$
12,669
$
1,778
$
(14,342
)
$
10,595
Liabilities and Shareholders’ Equity
Current Liabilities:
Current debt
$
3
$
140
$
-
$
-
$
140
$
76
$
-
$
219
Trade accounts payable
15
375
550
-
925
73
-
1,013
Other current liabilities
2,790
251
296
(24
)
523
399
(2,951
)
761
Total Current Liabilities
2,808
766
846
(24
)
1,588
548
(2,951
)
1,993
Long-Term Debt
3,187
15
180
-
195
131
(180
)
3,333
Deferred Income Taxes
-
108
182
-
290
27
(37
)
280
Other Liabilities
143
161
202
-
363
33
-
539
Minority Interest
-
-
-
-
-
98
-
98
Shareholders’ Equity
4,352
3,732
8,098
(1,597
)
10,233
941
(11,174
)
4,352
Total Liabilities and Shareholders’ Equity
$
10,490
$
4,782
$
9,508
$
(1,621
)
$
12,669
$
1,778
$
(14,342
)
$
10,595