Tyson Foods 2009 Annual Report Download - page 30
Download and view the complete annual report
Please find page 30 of the 2009 Tyson Foods annual report below. You can navigate through the pages in the report by either clicking on the pages listed below, or by using the keyword search tool below to find specific information within the annual report.-
 1
1 -
2
-
3
-
4
-
5
-
6
-
7
-
8
-
9
-
10
-
11
-
12
-
13
-
14
-
15
-
16
-
17
-
18
-
19
-
 20
20 -
 21
21 -
 22
22 -
 23
23 -
 24
24 -
 25
25 -
 26
26 -
 27
27 -
 28
28 -
 29
29 -
 30
30 -
 31
31 -
 32
32 -
 33
33 -
 34
34 -
 35
35 -
 36
36 -
 37
37 -
 38
38 -
 39
39 -
 40
40 -
41
-
42
-
43
-
44
-
45
-
46
-
47
-
48
-
49
-
50
-
51
-
52
-
53
-
54
-
55
-
56
-
57
-
58
-
59
-
60
-
61
-
62
-
63
-
64
-
65
-
66
-
67
-
68
-
69
-
70
-
71
-
72
-
73
-
74
-
75
-
76
-
77
-
78
-
79
-
80
-
81
-
82
-
83
-
84
-
85
-
86
-
87
-
88
-
89
-
90
-
91
-
92
 |
 |

30
agreement. Our maximum obligation associated with these programs is limited to the fair value of each participating livestock
supplier’s net tangible assets. Although we believe the aggregate maximum obligation under the program is unlikely to ever be
reached, the potential maximum obligation as of October 3, 2009, is approximately $250 million. The total receivables under these
programs were $72 million and $7 million at October 3, 2009 and September 27, 2008, respectively. Even though these programs are
limited to the net tangible assets of the participating livestock suppliers, we also manage a portion of our credit risk associated with
these programs by obtaining security interests in livestock suppliers' assets. After analyzing residual credit risks and general market
conditions, we have recorded an allowance for these programs' estimated uncollectible receivables of $20 million and $2 million at
October 3, 2009, and September 27, 2008, respectively.
Investments
The value of our investments in equity and debt securities, including our marketable debt securities, company-owned life insurance
and pension and other postretirement plan assets, has been impacted by the market volatility over the past year. These instruments
were recorded at fair value as of October 3, 2009. During fiscal 2009, we had a reduction in fair value resulting in the recognition
through earnings of $11 million.
We currently oversee two domestic and one foreign subsidiary non-contributory qualified defined benefit pension plans. All three
pension plans are frozen to new participants and no additional benefits will accrue for participants. Based on our 2009 actuarial
valuation, we anticipate contributions of $2 million to these plans for fiscal 2010. We also have one domestic unfunded defined
benefit plan. Based on our 2009 actuarial valuation, we anticipate contributions of $2 million to this plan for fiscal 2010.
Financial Instruments
As part of our commodity risk management activities, we use derivative financial instruments, primarily futures and options, to
reduce our exposure to various market risks related to commodity purchases. Similar to the capital markets, the commodities markets
have been volatile over the past year. Grain and some energy prices reached an all-time high during our fourth quarter of fiscal 2008
before falling sharply. While the reduction in grain and energy prices benefit us long-term, we recorded losses related to these
financial instruments in fiscal 2009 of $257 million. We have recently implemented policies to reduce our earnings volatility
associated with mark-to-market derivative activities, including more use of normal physical purchases and normal physical sales
which are not required to be marked to market.
Insurance
We rely on insurers as a protection against liability claims, property damage and various other risks. Our primary insurers maintain an
A.M. Best Financial Strength Rating of A or better. Nevertheless, we continue to monitor this situation as insurers have been and are
expected to continue to be impacted by the current capital market environment.
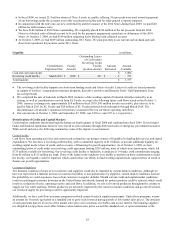
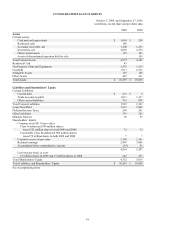
Capitalization
in millions
2009
2008
Senior notes
$
3,323
$
2,858
GO Zone tax-exempt bonds
100
-
Other indebtedness
129
38
Total Debt
$
3,552
$
2,896
Total Equity
$
4,352
$
5,014
Debt to Capitalization Ratio
44.9
%
36.6
%
●
In fiscal 2009, we issued $810 million of 2014 Notes. The 2014 Notes had an original issue discount of $59 million, based on
an issue price of 92.756% of face value. We used the net proceeds towards the repayment of our borrowings under our
accounts receivable securitization facility and for other general corporate purposes. In addition, Dynamic Fuels received $100
million in proceeds from the sale of Gulf Opportunity Zone tax-exempt bonds made available by the Federal government to
the regions affected by Hurricane Katrina and Rita in 2005. These floating rate bonds are due October 1, 2033.
●
In fiscal 2009, we bought back $293 million of notes, which included: $161 million 2011 Notes; $94 million 2010 Notes; and
$38 million 2016 Notes.
●
At October 3, 2009, we had a total of approximately $1.2 billion of cash and cash equivalents and restricted cash.