Tyson Foods 2009 Annual Report Download - page 57
Download and view the complete annual report
Please find page 57 of the 2009 Tyson Foods annual report below. You can navigate through the pages in the report by either clicking on the pages listed below, or by using the keyword search tool below to find specific information within the annual report.-
 1
1 -
2
-
3
-
4
-
5
-
6
-
7
-
8
-
9
-
10
-
11
-
12
-
13
-
14
-
15
-
16
-
17
-
18
-
19
-
20
-
21
-
22
-
23
-
24
-
25
-
26
-
27
-
28
-
29
-
30
-
31
-
32
-
33
-
34
-
35
-
36
-
37
-
38
-
39
-
40
-
41
-
42
-
43
-
44
-
45
-
46
-
 47
47 -
 48
48 -
 49
49 -
 50
50 -
 51
51 -
 52
52 -
 53
53 -
 54
54 -
 55
55 -
 56
56 -
 57
57 -
 58
58 -
 59
59 -
 60
60 -
 61
61 -
 62
62 -
 63
63 -
 64
64 -
 65
65 -
 66
66 -
 67
67 -
68
-
69
-
70
-
71
-
72
-
73
-
74
-
75
-
76
-
77
-
78
-
79
-
80
-
81
-
82
-
83
-
84
-
85
-
86
-
87
-
88
-
89
-
90
-
91
-
92
 |
 |

57
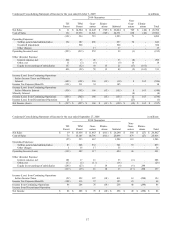
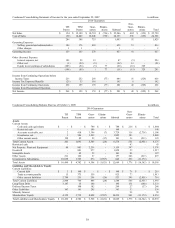
Condensed Consolidating Statement of Income for the year ended October 3, 2009
in millions
2014 Guarantors
TFI
Parent
TFM
Parent
Guar-
antors
Elimin-
ations
Subtotal
Non-
Guar-
antors
Elimin-
ations
Total
Net Sales
$
11
$
14,504
$
12,245
$
(725
)
$
26,024
$
709
$
(40
)
$
26,704
Cost of Sales
132
13,970
11,526
(725
)
24,771
638
(40
)
25,501
(121
)
534
719
-
1,253
71
-
1,203
Operating Expenses:
Selling, general and administrative
132
187
450
-
637
72
-
841
Goodwill impairment
-
560
-
-
560
-
-
560
Other charges
-
-
17
-
17
-
-
17
Operating Income (Loss)
(253
)
(213
)
252
-
39
(1
)
-
(215
)
Other (Income) Expense:
Interest expense, net
268
13
20
-
33
(8
)
-
293
Other, net
11
(3
)
(6
)
-
(9
)
16
-
18
Equity in net earnings of subsidiaries
157
(32
)
44
13
25
(17
)
(165
)
-
436
(22
)
58
13
49
(9
)
(165
)
311
Income (Loss) from Continuing Operations
before Income Taxes and Minority
Interest
(689
)
(191
)
194
(13
)
(10
)
8
165
(526
)
Income Tax Expense (Benefit)
(131
)
111
34
-
145
-
-
14
Income (Loss) from Continuing Operations
before Minority Interest
(558
)
(302
)
160
(13
)
(155
)
8
165
(540
)
Minority Interest
-
-
-
-
-
(4
)
-
(4
)
Income (Loss) from Continuing Operations
(558
)
(302
)
160
(13
)
(155
)
12
165
(536
)
Income (Loss) from Discontinued Operation
21
5
-
-
5
(27
)
-
(1
)
Net Income (Loss)
$
(537
)
$
(297
)
$
160
$
(13
)
$
(150
)
$
(15
)
$
165
$
(537
)
Condensed Consolidating Statement of Income for the year ended September 27, 2008
in millions
2014 Guarantors
TFI
Parent
TFM
Parent
Guar-
antors
Elimin-
ations
Subtotal
Non-
Guar-
antors
Elimin-
ations
Total
Net Sales
$
19
$
15,638
$
11,463
$
(811
)
$
26,290
$
580
$
(27
)
$
26,862
Cost of Sales
74
15,105
10,796
(811
)
25,090
479
(27
)
25,616
(55
)
533
667
-
1,200
101
-
1,246
Operating Expenses:
Selling, general and administrative
83
208
533
-
741
55
-
879
Other charges
1
18
17
-
35
-
-
36
Operating Income (Loss)
(139
)
307
117
-
424
46
-
331
Other (Income) Expense:
Interest expense, net
181
17
16
-
33
(8
)
-
206
Other, net
(13
)
(5
)
(11
)
-
(16
)
-
-
(29
)
Equity in net earnings of subsidiaries
(285
)
(27
)
5
18
(4
)
(9
)
298
-
(117
)
(15
)
10
18
13
(17
)
298
177
Income (Loss) from Continuing Operations
before Income Taxes
(22
)
322
107
(18
)
411
63
(298
)
154
Income Tax Expense (Benefit)
(108
)
116
37
-
153
23
-
68
Income from Continuing Operations
86
206
70
(18
)
258
40
(298
)
86
Income from Discontinued Operation
-
-
-
-
-
-
-
-
Net Income
$
86
$
206
$
70
$
(18
)
$
258
$
40
$
(298
)
$
86