Tyson Foods 2009 Annual Report Download - page 72
Download and view the complete annual report
Please find page 72 of the 2009 Tyson Foods annual report below. You can navigate through the pages in the report by either clicking on the pages listed below, or by using the keyword search tool below to find specific information within the annual report.-
 1
1 -
2
-
3
-
4
-
5
-
6
-
7
-
8
-
9
-
10
-
11
-
12
-
13
-
14
-
15
-
16
-
17
-
18
-
19
-
20
-
21
-
22
-
23
-
24
-
25
-
26
-
27
-
28
-
29
-
30
-
31
-
32
-
33
-
34
-
35
-
36
-
37
-
38
-
39
-
40
-
41
-
42
-
43
-
44
-
45
-
46
-
47
-
48
-
49
-
50
-
51
-
52
-
53
-
54
-
55
-
56
-
57
-
58
-
59
-
60
-
61
-
 62
62 -
 63
63 -
 64
64 -
 65
65 -
 66
66 -
 67
67 -
 68
68 -
 69
69 -
 70
70 -
 71
71 -
 72
72 -
 73
73 -
 74
74 -
 75
75 -
 76
76 -
 77
77 -
 78
78 -
 79
79 -
 80
80 -
 81
81 -
 82
82 -
83
-
84
-
85
-
86
-
87
-
88
-
89
-
90
-
91
-
92
 |
 |

72
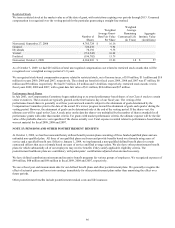
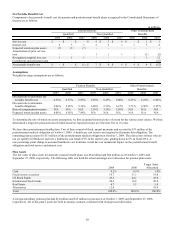
The amount of unrecognized tax benefits, if recognized, that would affect our effective tax rate was $104 million and $73 million at
October 3, 2009 and at September 27, 2008, respectively. We classify interest and penalties on unrecognized tax benefits as income
tax expense. At October 3, 2009, and at September 27, 2008, before tax benefits, we had $71 million and $67 million, respectively, of
accrued interest and penalties on unrecognized tax benefits.
As of October 3, 2009, we are subject to income tax examinations for U.S. federal income taxes for fiscal years 1998 through 2008,
excluding 2001 and 2002, and for foreign, state and local income taxes for fiscal years 2001 through 2008. During fiscal 2010, tax
audit resolutions could potentially reduce our unrecognized tax benefits by approximately $19 million, either because tax positions
are sustained on audit or because we agree to their disallowance.
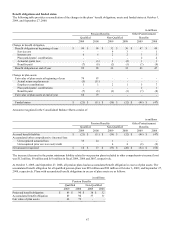
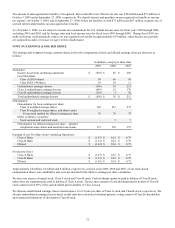
NOTE 19: EARNINGS (LOSS) PER SHARE
The earnings and weighted average common shares used in the computation of basic and diluted earnings (loss) per share are as
follows:
in millions, except per share data
2009
2008
2007
Numerator:
Income (loss) from continuing operations
$
(536
)
$
86
$
268
Less Dividends:
Class A ($0.16/share)
50
46
45
Class B ($0.144/share)
10
10
11
Undistributed earnings (losses)
(596
)
30
212
Class A undistributed earnings (losses)
(493
)
25
170
Class B undistributed earnings (losses)
(103
)
5
42
Total undistributed earnings (losses)
$
(596
)
$
30
$
212
Denominator:
Denominator for basic earnings per share:
Class A weighted average shares
302
281
273
Class B weighted average shares, and shares under
if-converted method for diluted earnings per share
70
70
75
Effect of dilutive securities:
Stock options and restricted stock
-
5
7
Denominator for diluted earnings per share – adjusted
weighted average shares and assumed conversions
372
356
355
Earnings (Loss) Per Share from Continuing Operations:
Class A Basic
$
(1.47
)
$
0.25
$
0.79
Class B Basic
$
(1.32
)
$
0.22
$
0.70
Diluted
$
(1.44
)
$
0.24
$
0.75
Net income (loss):
Class A Basic
$
(1.47
)
$
0.25
$
0.79
Class B Basic
$
(1.32
)
$
0.22
$
0.70
Diluted
$
(1.44
)
$
0.24
$
0.75
Approximately 24 million, 10 million and 4 million, respectively, in fiscal years 2009, 2008 and 2007, of our stock-based
compensation shares were antidilutive and were not included in the dilutive earnings per share calculation.
We have two classes of capital stock, Class A stock and Class B stock. Cash dividends cannot be paid to holders of Class B stock
unless they are simultaneously paid to holders of Class A stock. The per share amount of cash dividends paid to holders of Class B
stock cannot exceed 90% of the cash dividend paid to holders of Class A stock.
We allocate undistributed earnings (losses) based upon a 1 to 0.9 ratio per share of Class A stock and Class B stock, respectively. We
allocate undistributed earnings (losses) based on this ratio due to historical dividend patterns, voting control of Class B shareholders
and contractual limitations of dividends to Class B stock.