Tyson Foods 2009 Annual Report Download - page 27
Download and view the complete annual report
Please find page 27 of the 2009 Tyson Foods annual report below. You can navigate through the pages in the report by either clicking on the pages listed below, or by using the keyword search tool below to find specific information within the annual report.-
 1
1 -
2
-
3
-
4
-
5
-
6
-
7
-
8
-
9
-
10
-
11
-
12
-
13
-
14
-
15
-
16
-
 17
17 -
 18
18 -
 19
19 -
 20
20 -
 21
21 -
 22
22 -
 23
23 -
 24
24 -
 25
25 -
 26
26 -
 27
27 -
 28
28 -
 29
29 -
 30
30 -
 31
31 -
 32
32 -
 33
33 -
 34
34 -
 35
35 -
 36
36 -
 37
37 -
38
-
39
-
40
-
41
-
42
-
43
-
44
-
45
-
46
-
47
-
48
-
49
-
50
-
51
-
52
-
53
-
54
-
55
-
56
-
57
-
58
-
59
-
60
-
61
-
62
-
63
-
64
-
65
-
66
-
67
-
68
-
69
-
70
-
71
-
72
-
73
-
74
-
75
-
76
-
77
-
78
-
79
-
80
-
81
-
82
-
83
-
84
-
85
-
86
-
87
-
88
-
89
-
90
-
91
-
92
 |
 |

27
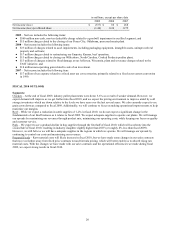
LIQUIDITY AND CAPITAL RESOURCES
Our cash needs for working capital, capital expenditures and growth opportunities are expected to be met with current cash on hand,
cash flows provided by operating activities, or short-term borrowings. Based on our current expectations, we believe our liquidity and
capital resources will be sufficient to operate our business. However, we may take advantage of opportunities to generate additional
liquidity or refinance through capital market transactions. The amount, nature and timing of any capital market transactions will
depend on our operating performance and other circumstances, our then-current commitments and obligations; the amount, nature and
timing of our capital requirements; any limitations imposed by our current credit arrangements; and overall market conditions.
Cash Flows from Operating Activities
in millions
2009
2008
2007
Net income (loss)
$
(537
)
$
86
$
268
Non-cash items in net income (loss):
Depreciation and amortization
496
493
514
Deferred taxes
(26
)
35
5
Impairment of goodwill
560
-
-
Impairment and write-down of assets
32
57
14
Other, net
68
26
(15
)
Changes in working capital
432
(409
)
(108
)
Net cash provided by operating activities
$
1,025
$
288
$
678
Changes in working capital:
●
2009 – Increased primarily due to a reduction in inventory and accounts receivable balances, partially offset by a reduction
in accounts payable. The lower inventory balance was primarily due to the reduction of inventory volumes, as well as a
decrease in raw material costs.
●
2008 – Decreased primarily due to higher inventory and accounts receivable balances, partially offset by a higher accounts
payable balance. Higher inventory balances were driven by an increase in raw material costs and inventory volume.
●
2007 – Decreased primarily due to higher inventory and accounts receivable balances, partially offset by a higher accounts
payable balance.
Cash Flows from Investing Activities
in millions
2009
2008
2007
Additions to property, plant and equipment
$
(368
)
$
(425
)
$
(285
)
Proceeds from sale of property, plant and equipment
9
26
76
Proceeds from sale (purchase) of marketable securities, net
19
(3
)
16
Proceeds from sale of short-term investment
-
-
770
Proceeds from sale of investments
15
22
-
Acquisitions, net of cash acquired
(93
)
(17
)
-
Proceeds from sale of discontinued operation
75
-
-
Change in restricted cash to be used for investing activities
(43
)
-
-
Other, net
(41
)
(2
)
2
Net cash provided by (used for) investing activities
$
(427
)
$
(399
)
$
579
●
Additions to property, plant and equipment include acquiring new equipment and upgrading our facilities to maintain
competitive standing and position us for future opportunities. In fiscal 2009, our capital spending included spending for:
improvements made in our prepared foods operations to increase efficiences; Dynamic Fuels LLC’s (Dynamic Fuels) first
facility; and foreign operations. In fiscal 2008, our capital spending included equipment updates in our chicken plants, as
well as packaging equipment upgrades in our Fresh Meats case-ready facilities. In fiscal 2007, we focused on reducing our
capital spending.
●
Capital spending for fiscal 2010 is expected to be approximately $600 million, and includes:
●
approximately $400 million on current core business capital spending;
●
approximately $150 million on foreign operations, which includes post-acquisition capital spending related to our
Brazil and China acquisitions; and
●
approximately $50 million related to Dynamic Fuels, most of which relates to the completion of Dynamic Fuels’
first facility. Construction of the first facility is expected to continue through early 2010, with production targeted
soon thereafter. At October 3, 2009, we had $43 million in restricted cash available for spending on this facility.